Caroline Dinh
Software developer & creative technologist
NEW BLOOD JOINS THIS EARTH (2024)
A heavy metal data visualization and interactive essay.
Role: Personal project
Tech stack: AnyChart.js, Flourish, React.js, Spotify API, Python
Approaches: Data visualization, digital storytelling, web scraping
I developed a data visualization about the international, inter-generational, cross-genre influence of Metallica, analyzing the 55 songs on Metallica’s cover compailation The Metallica Blacklist (2021) celebrating thirty years of their eponymous “Black Album.”
My process
I gathered the data from three sources: the Spotify API, an archive of everynoise.com, and publicly-available information from the Internet. For the first two, I wrote Python scripts - I created a script to query the Spotify API, and another script to scrape the HTML from a Wayback Machine link - to compile and format my data for visualization. This data went into the first and last charts in the visualization.
I then created Excel sheets to manually gather artists’ biographical information and quotes from critic reviews. This data formed the second and third charts in the visualization.
I based the visual aesthetics of the site on the packaging design of Metallica’s albums, and on the band’s archival collections.
Awards and recognition
🏅 Honorable Mention, Pudding Cup, 2024
🏅 Longlist, Information is Beautiful Awards, 2025
Development
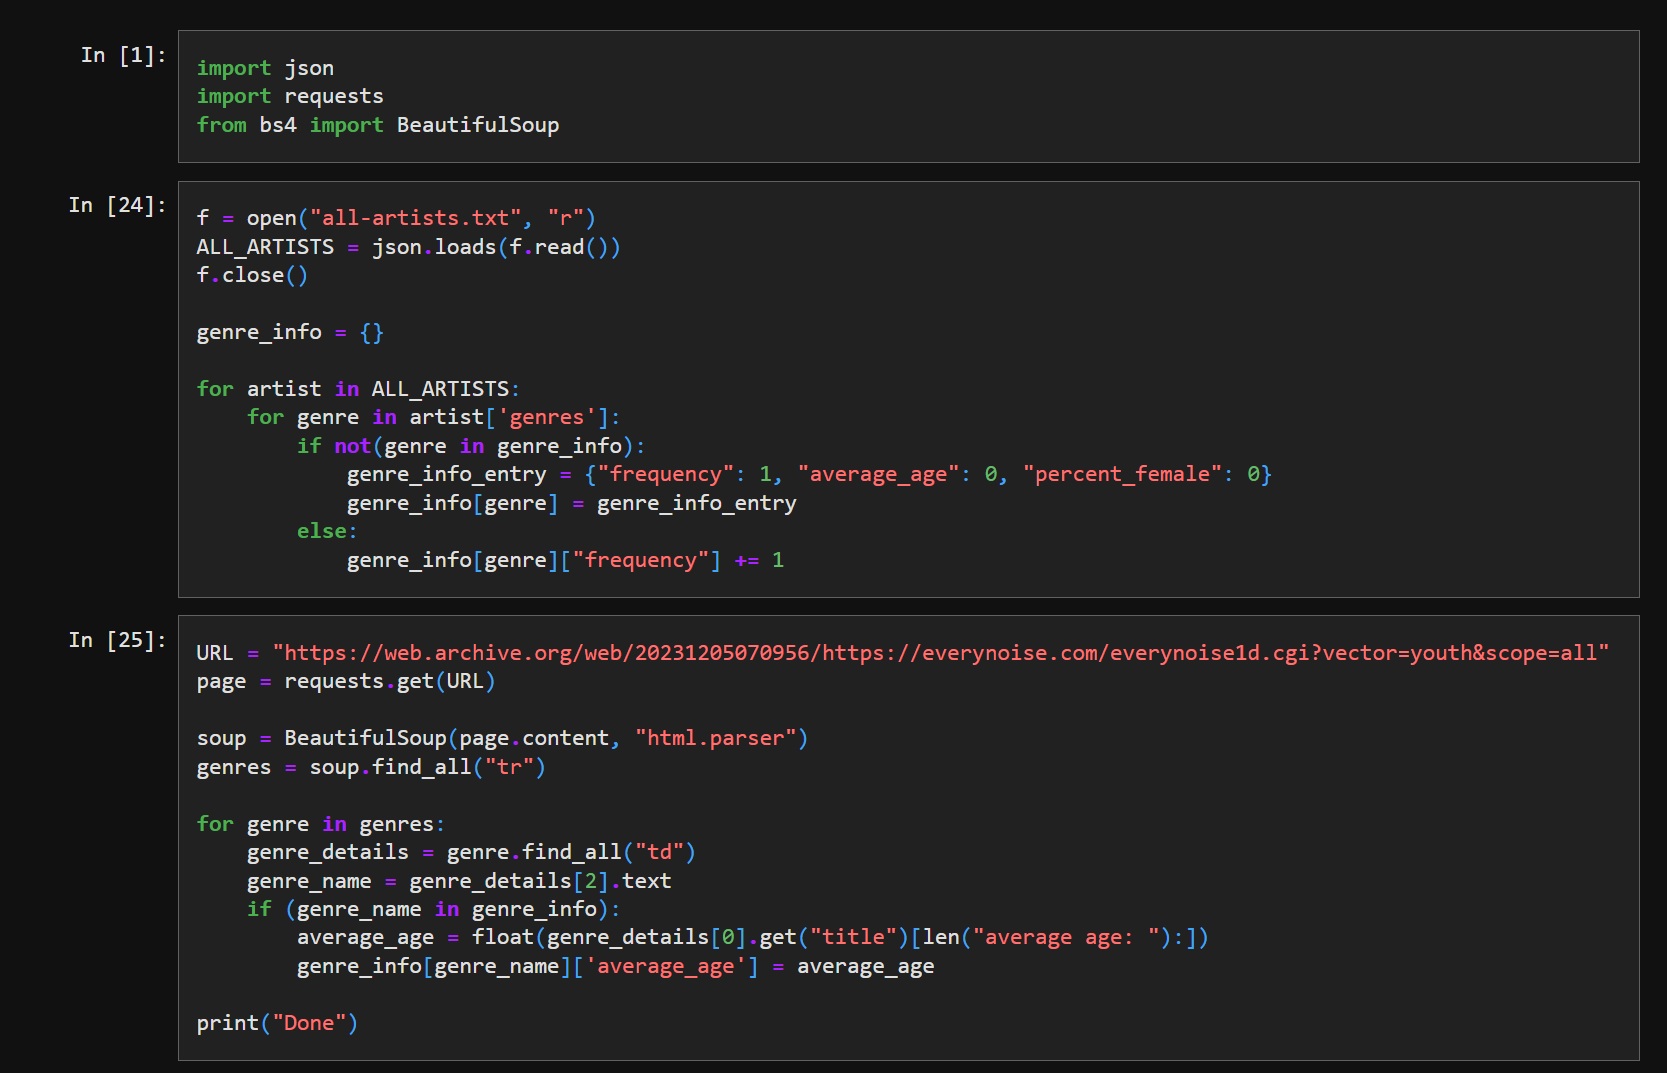
Building my datasets with Python scripting
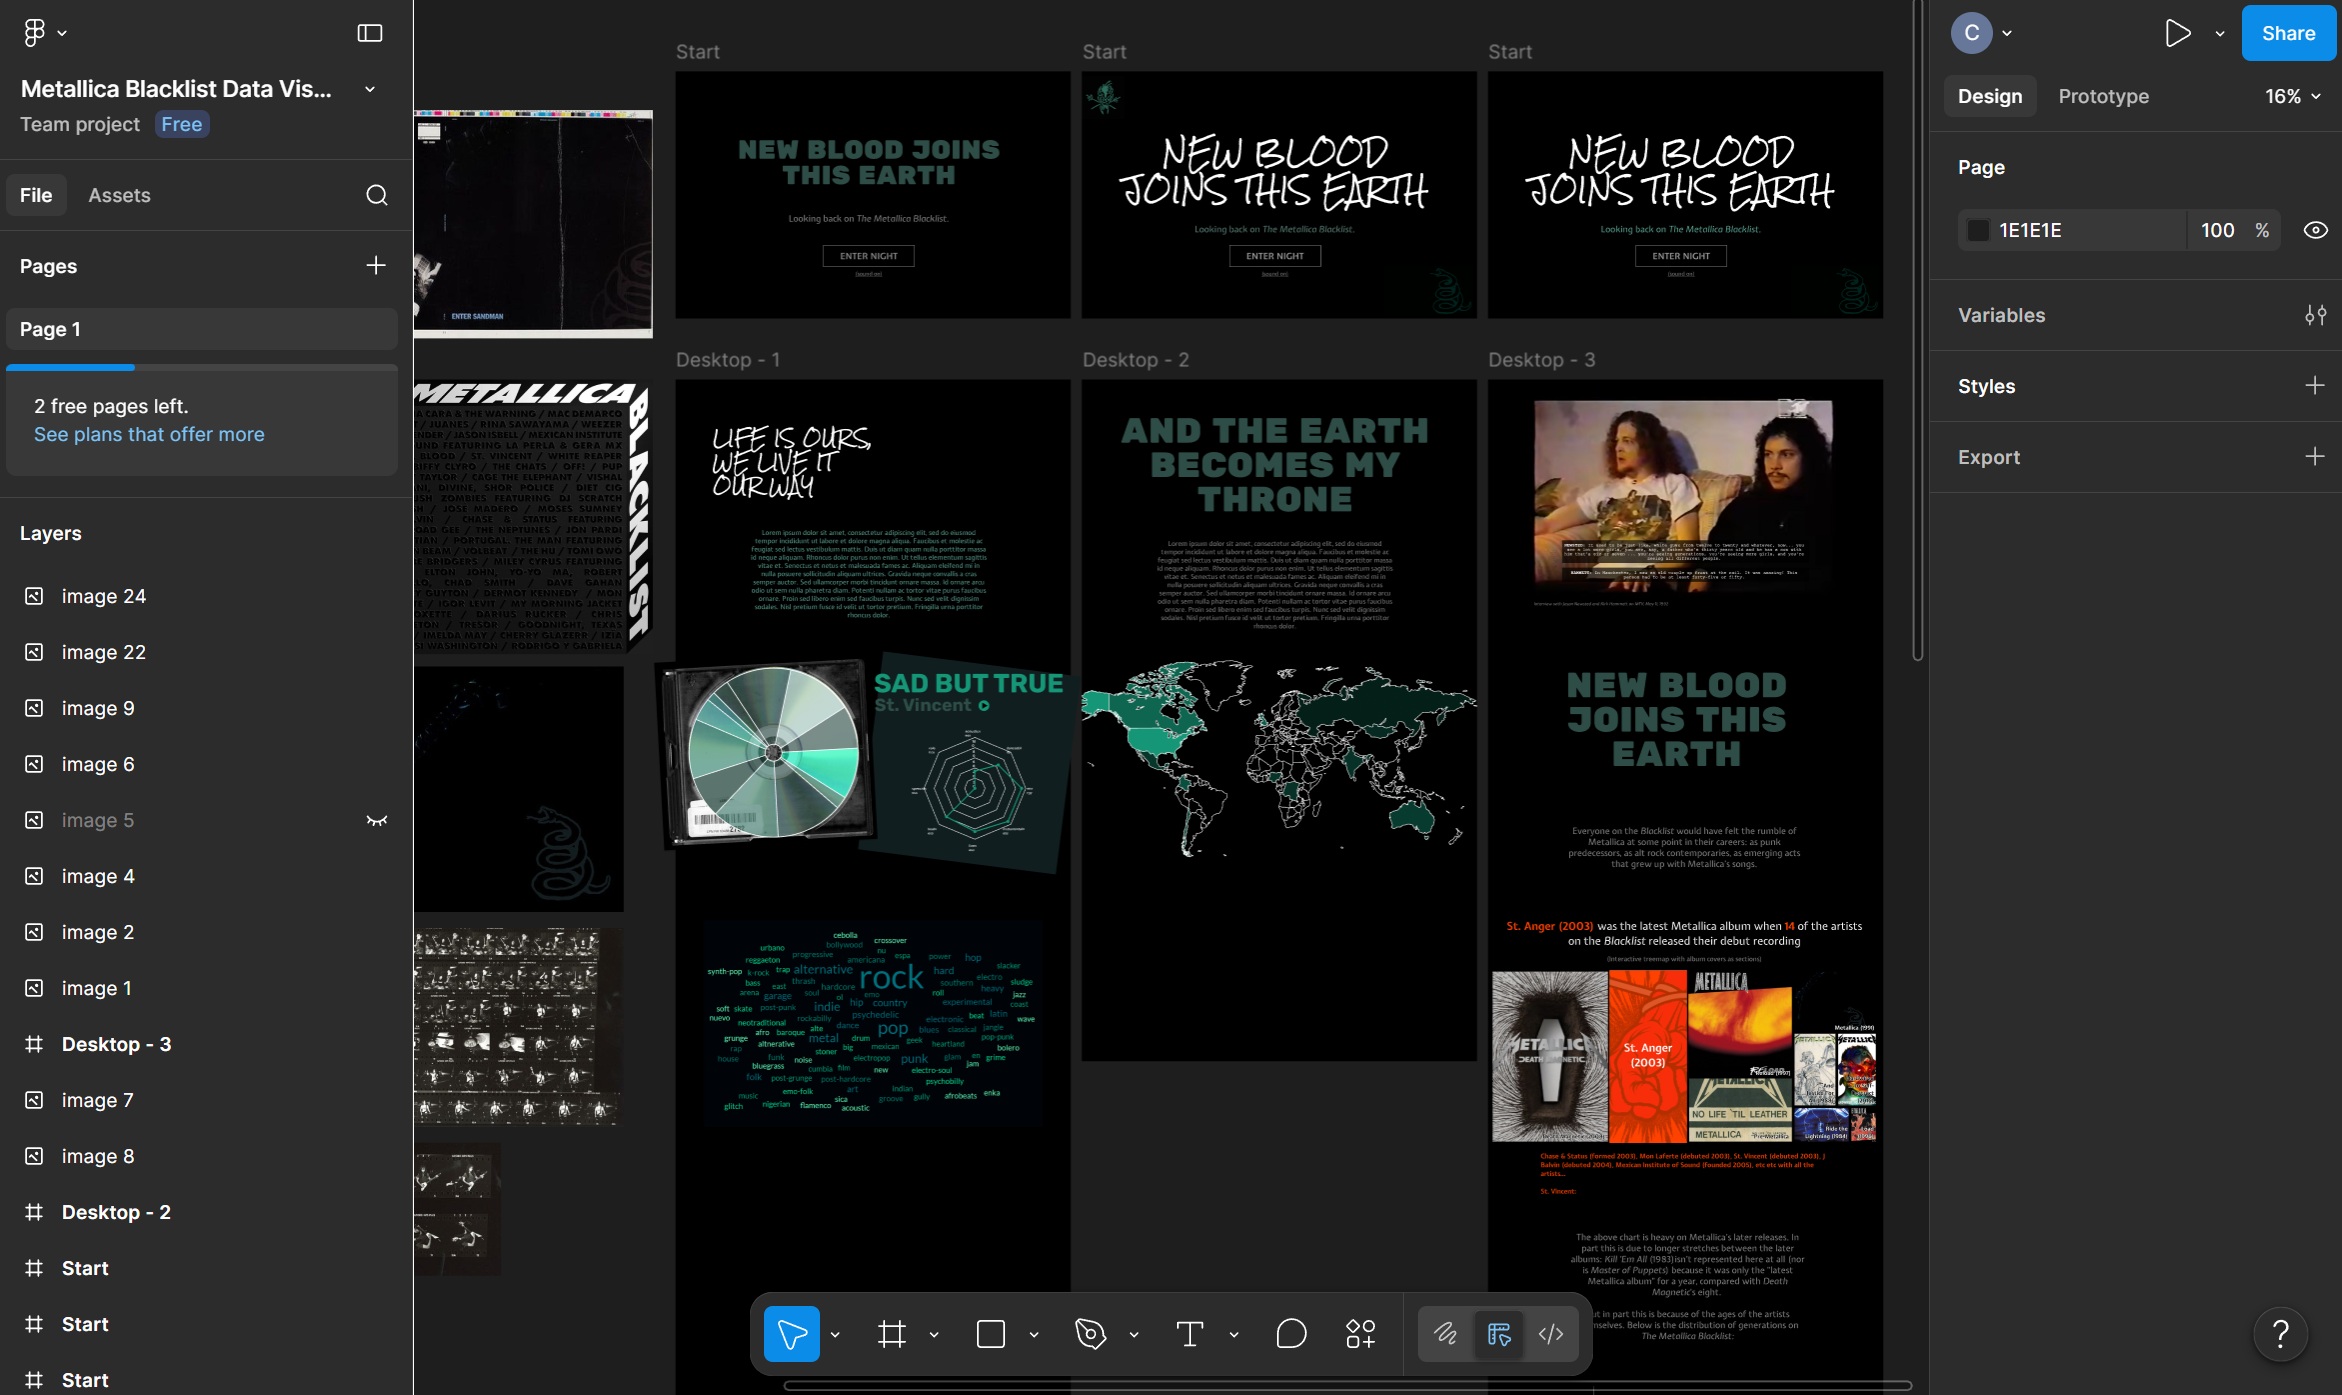
Drafting, designing, and moodboarding in Figma
Screens
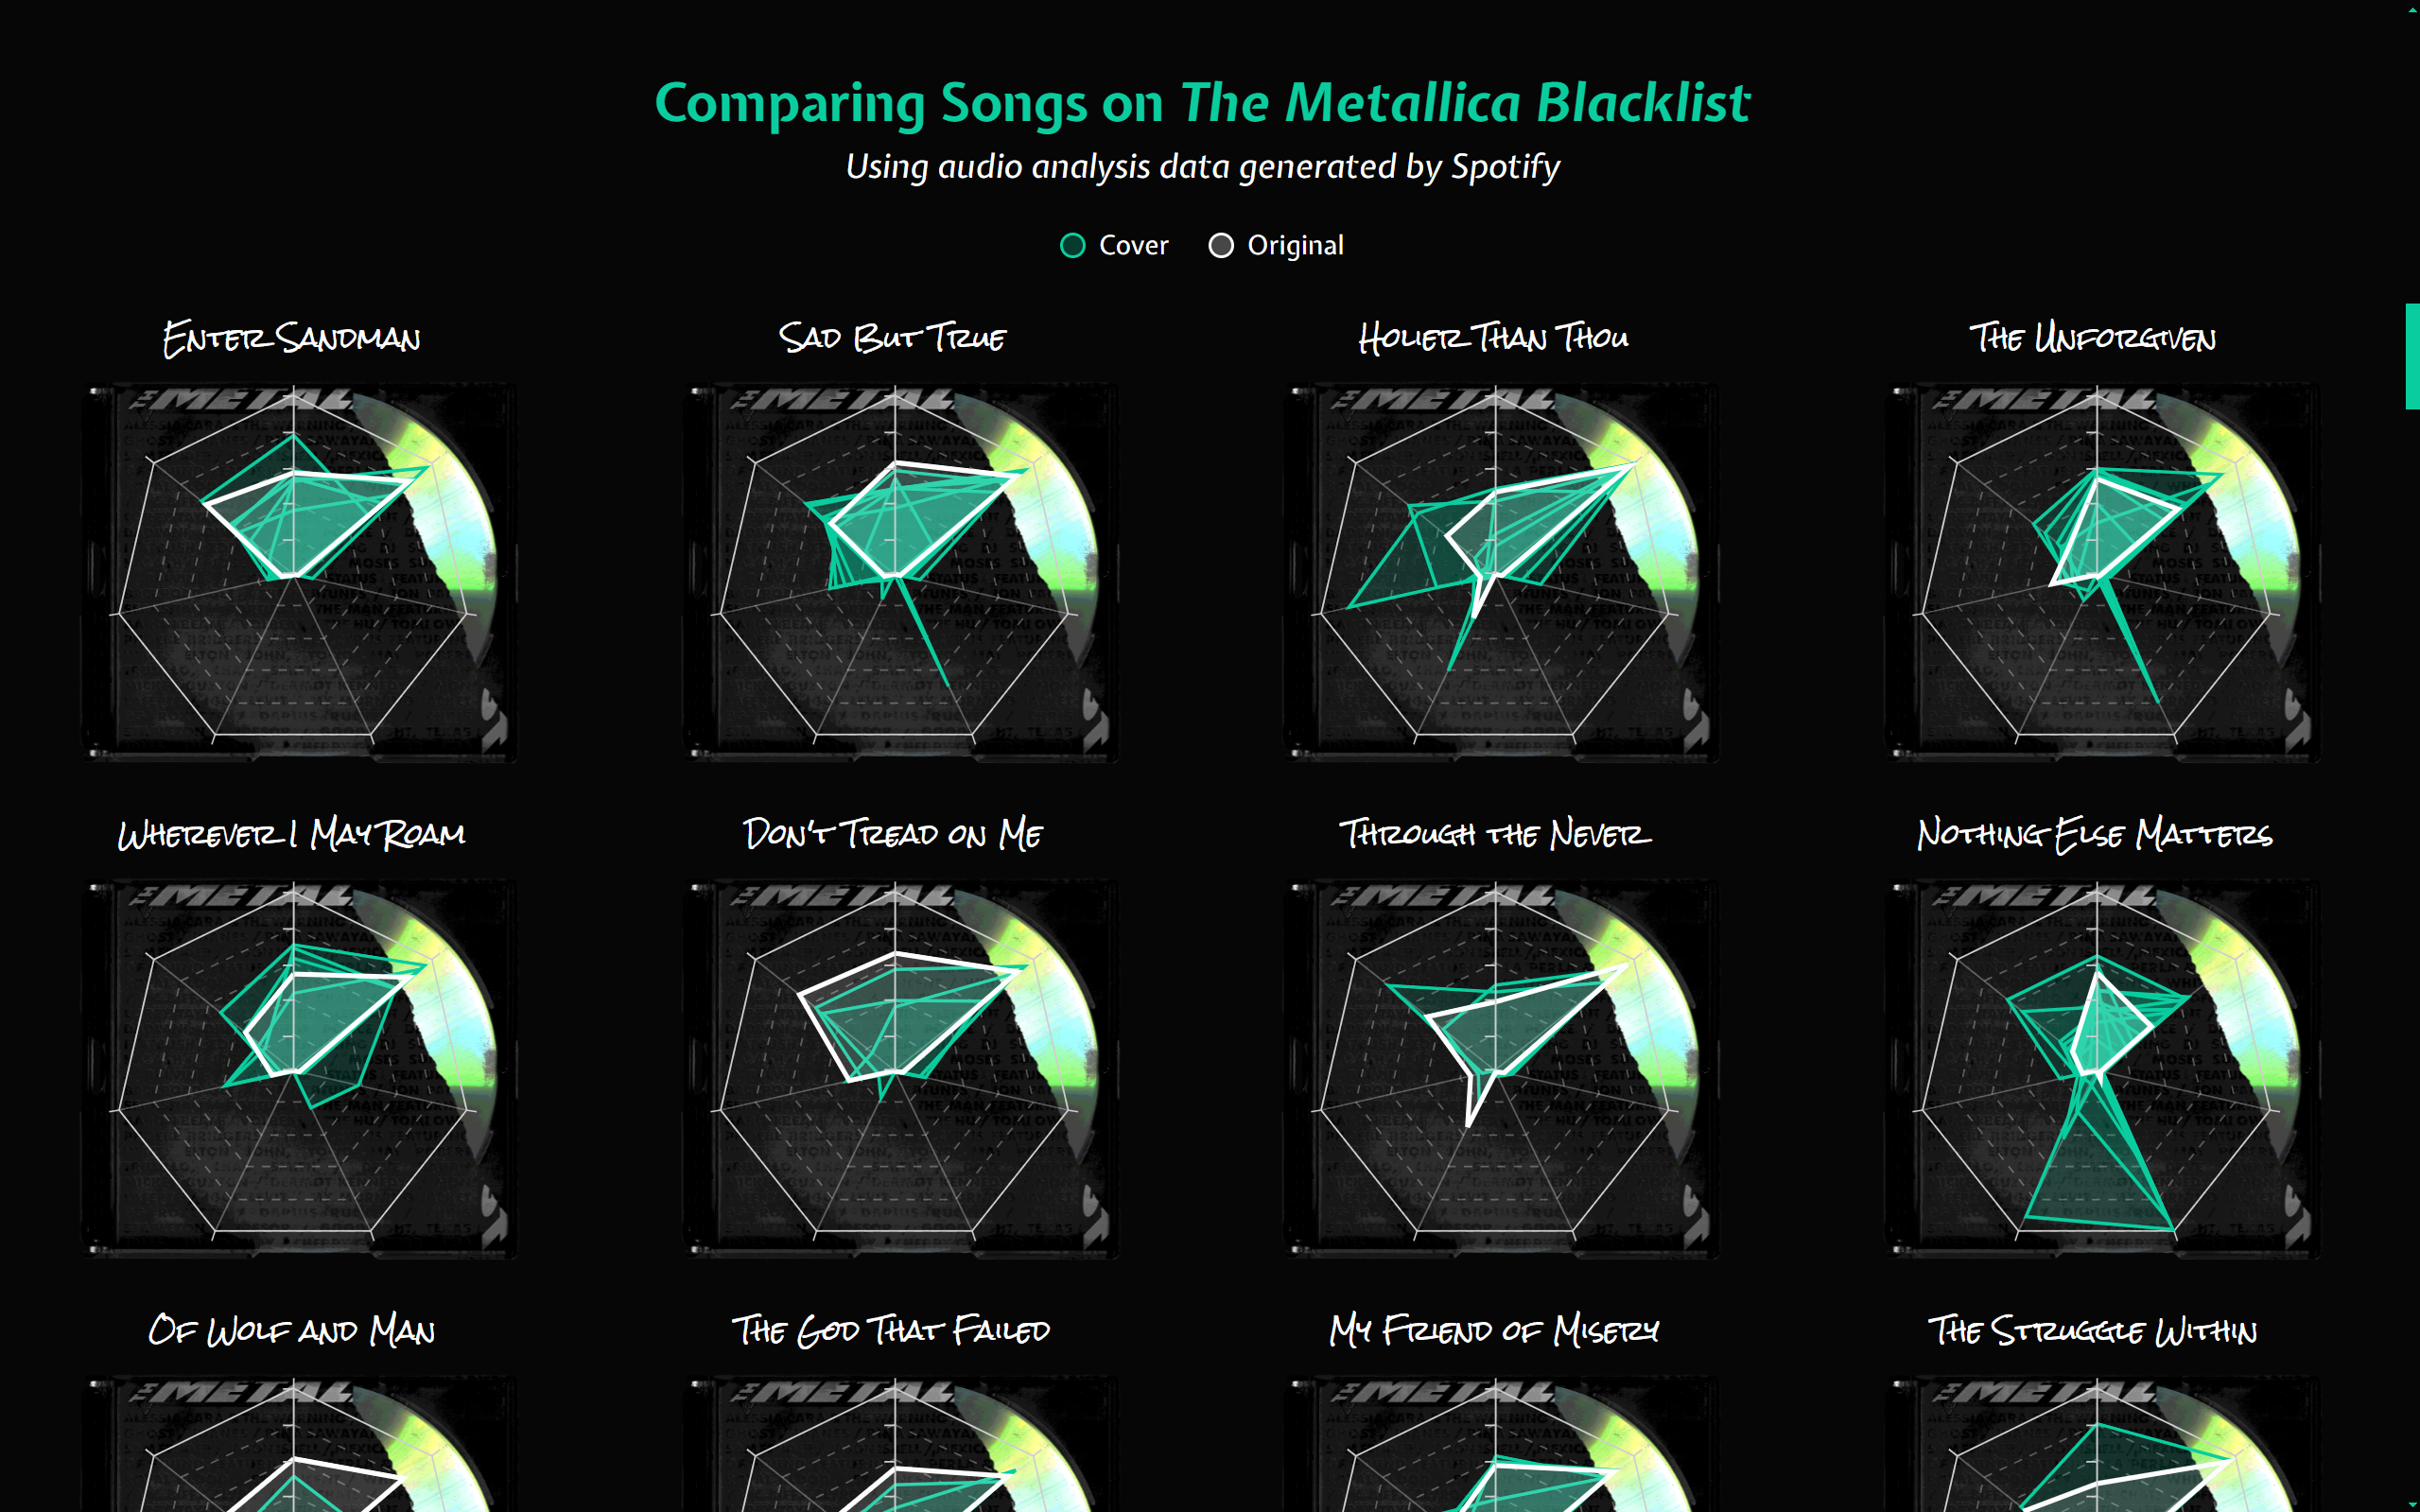
Comparing song features
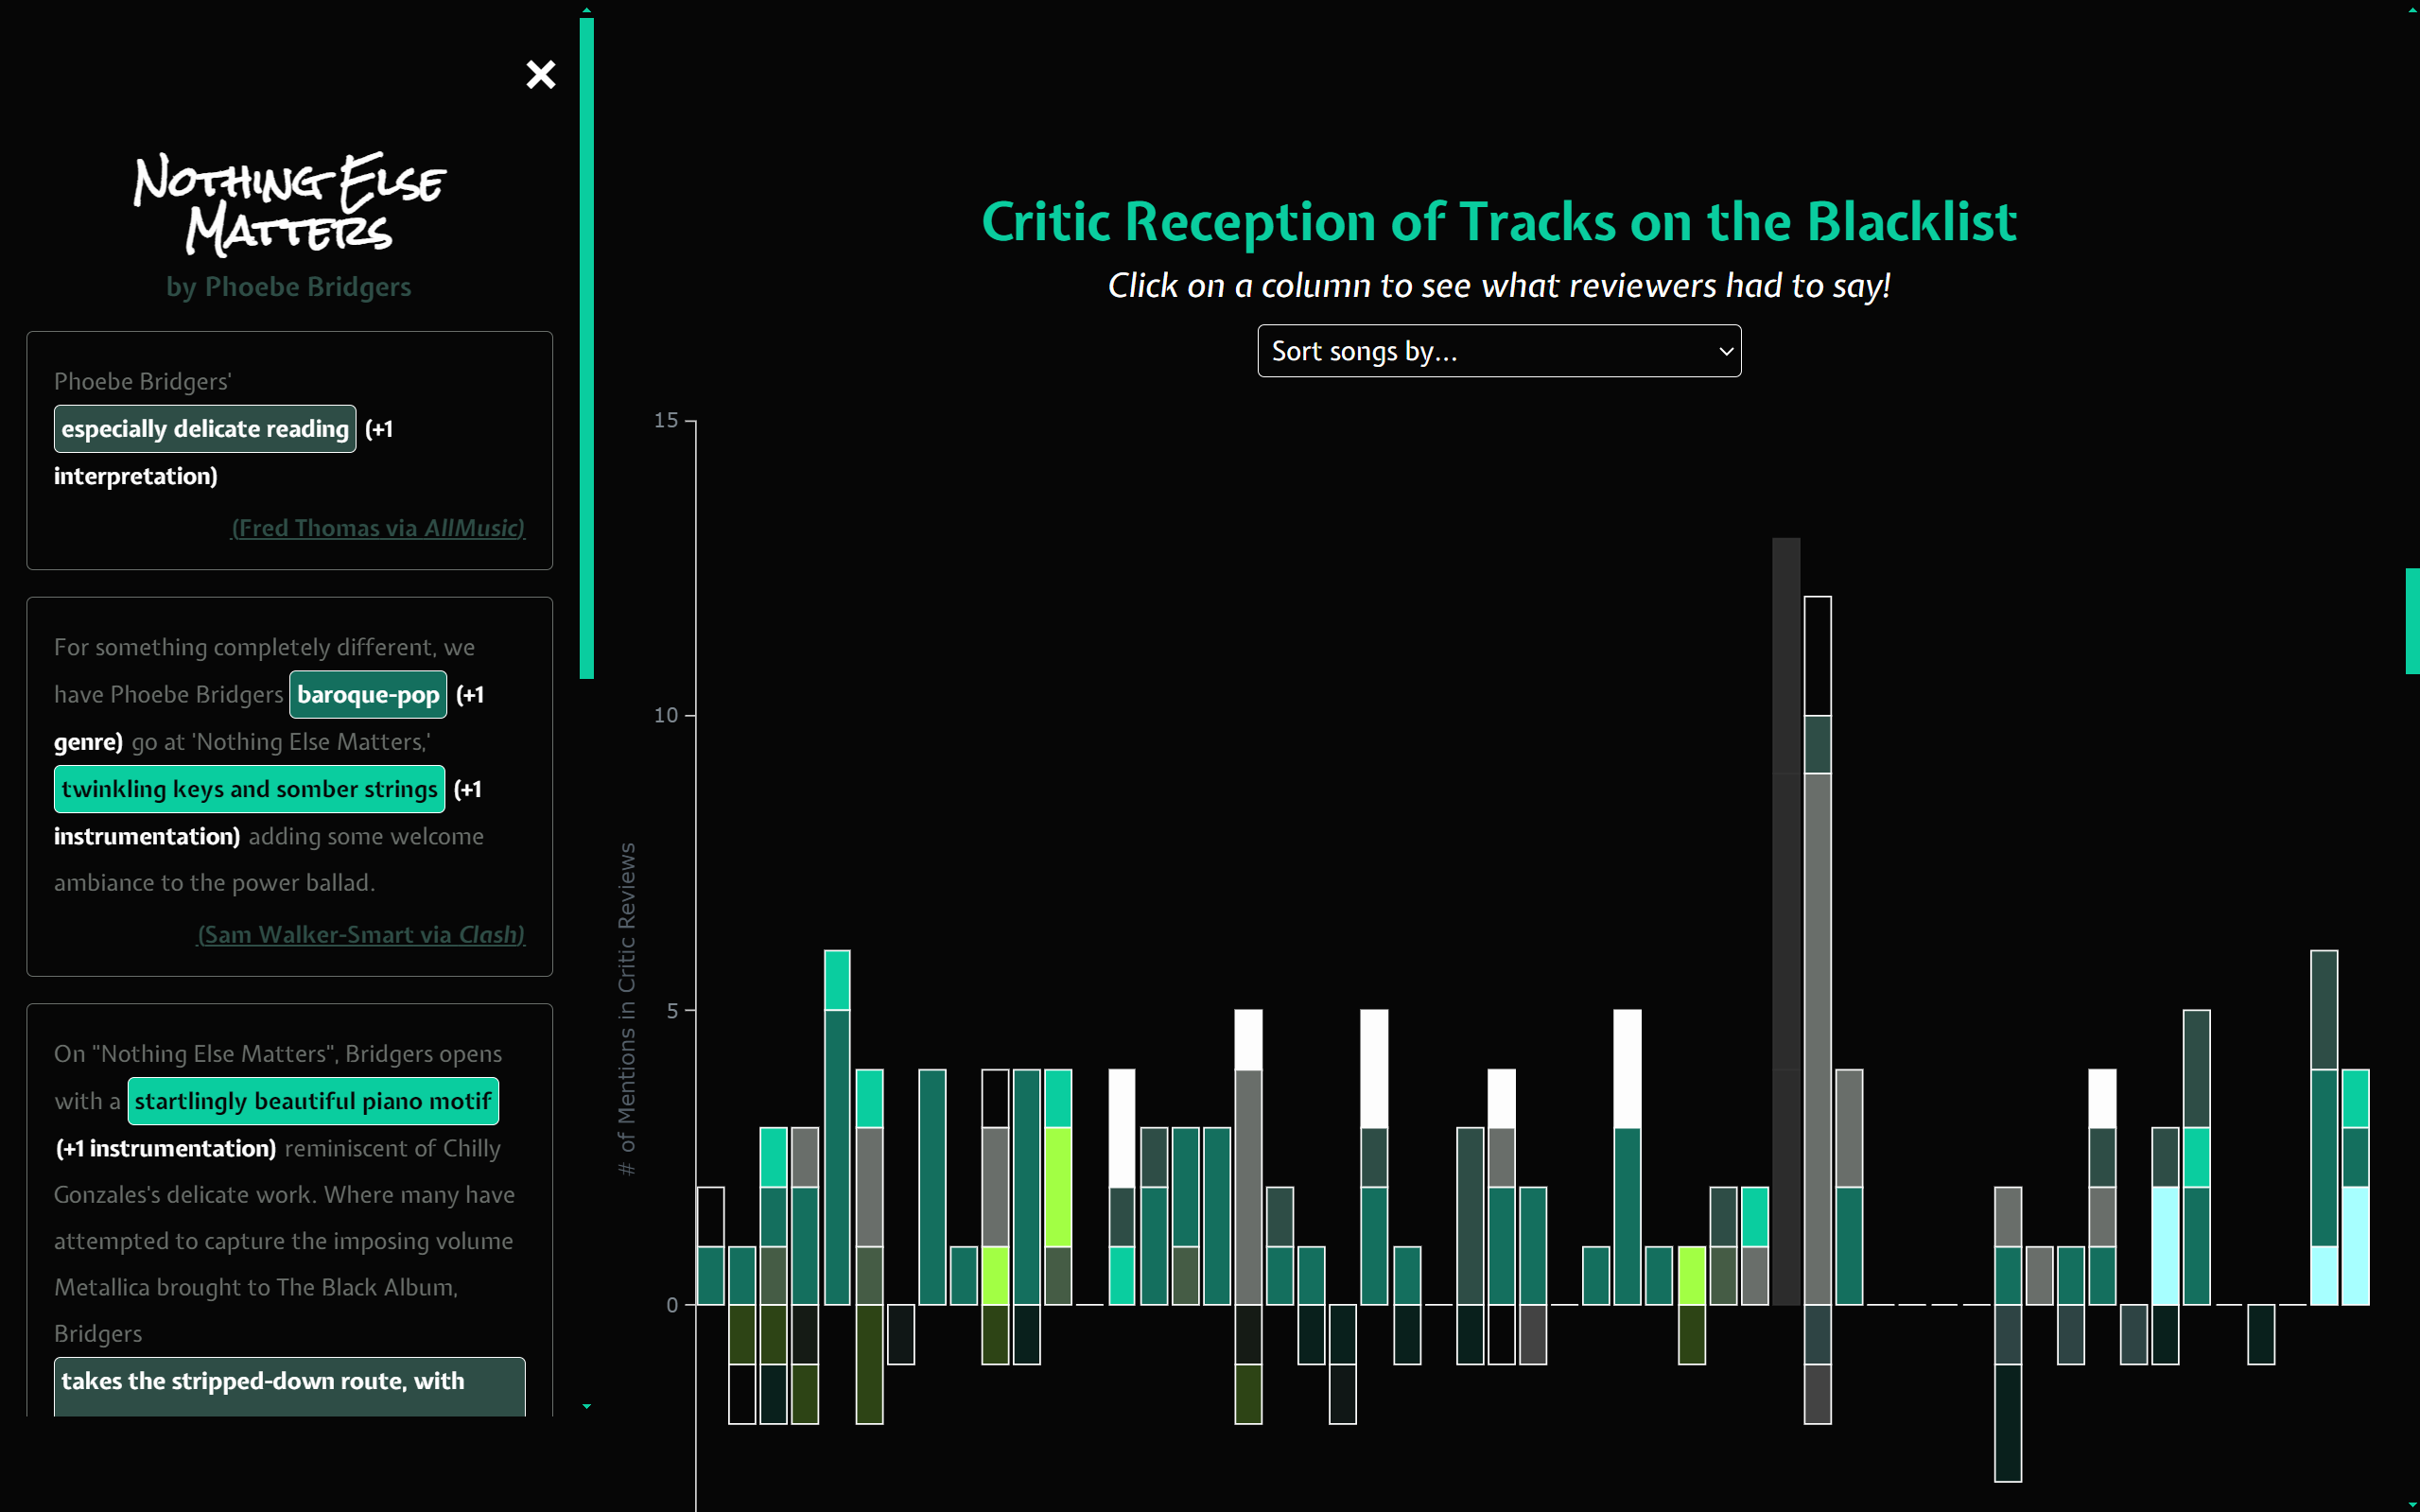
Comparing critic reception
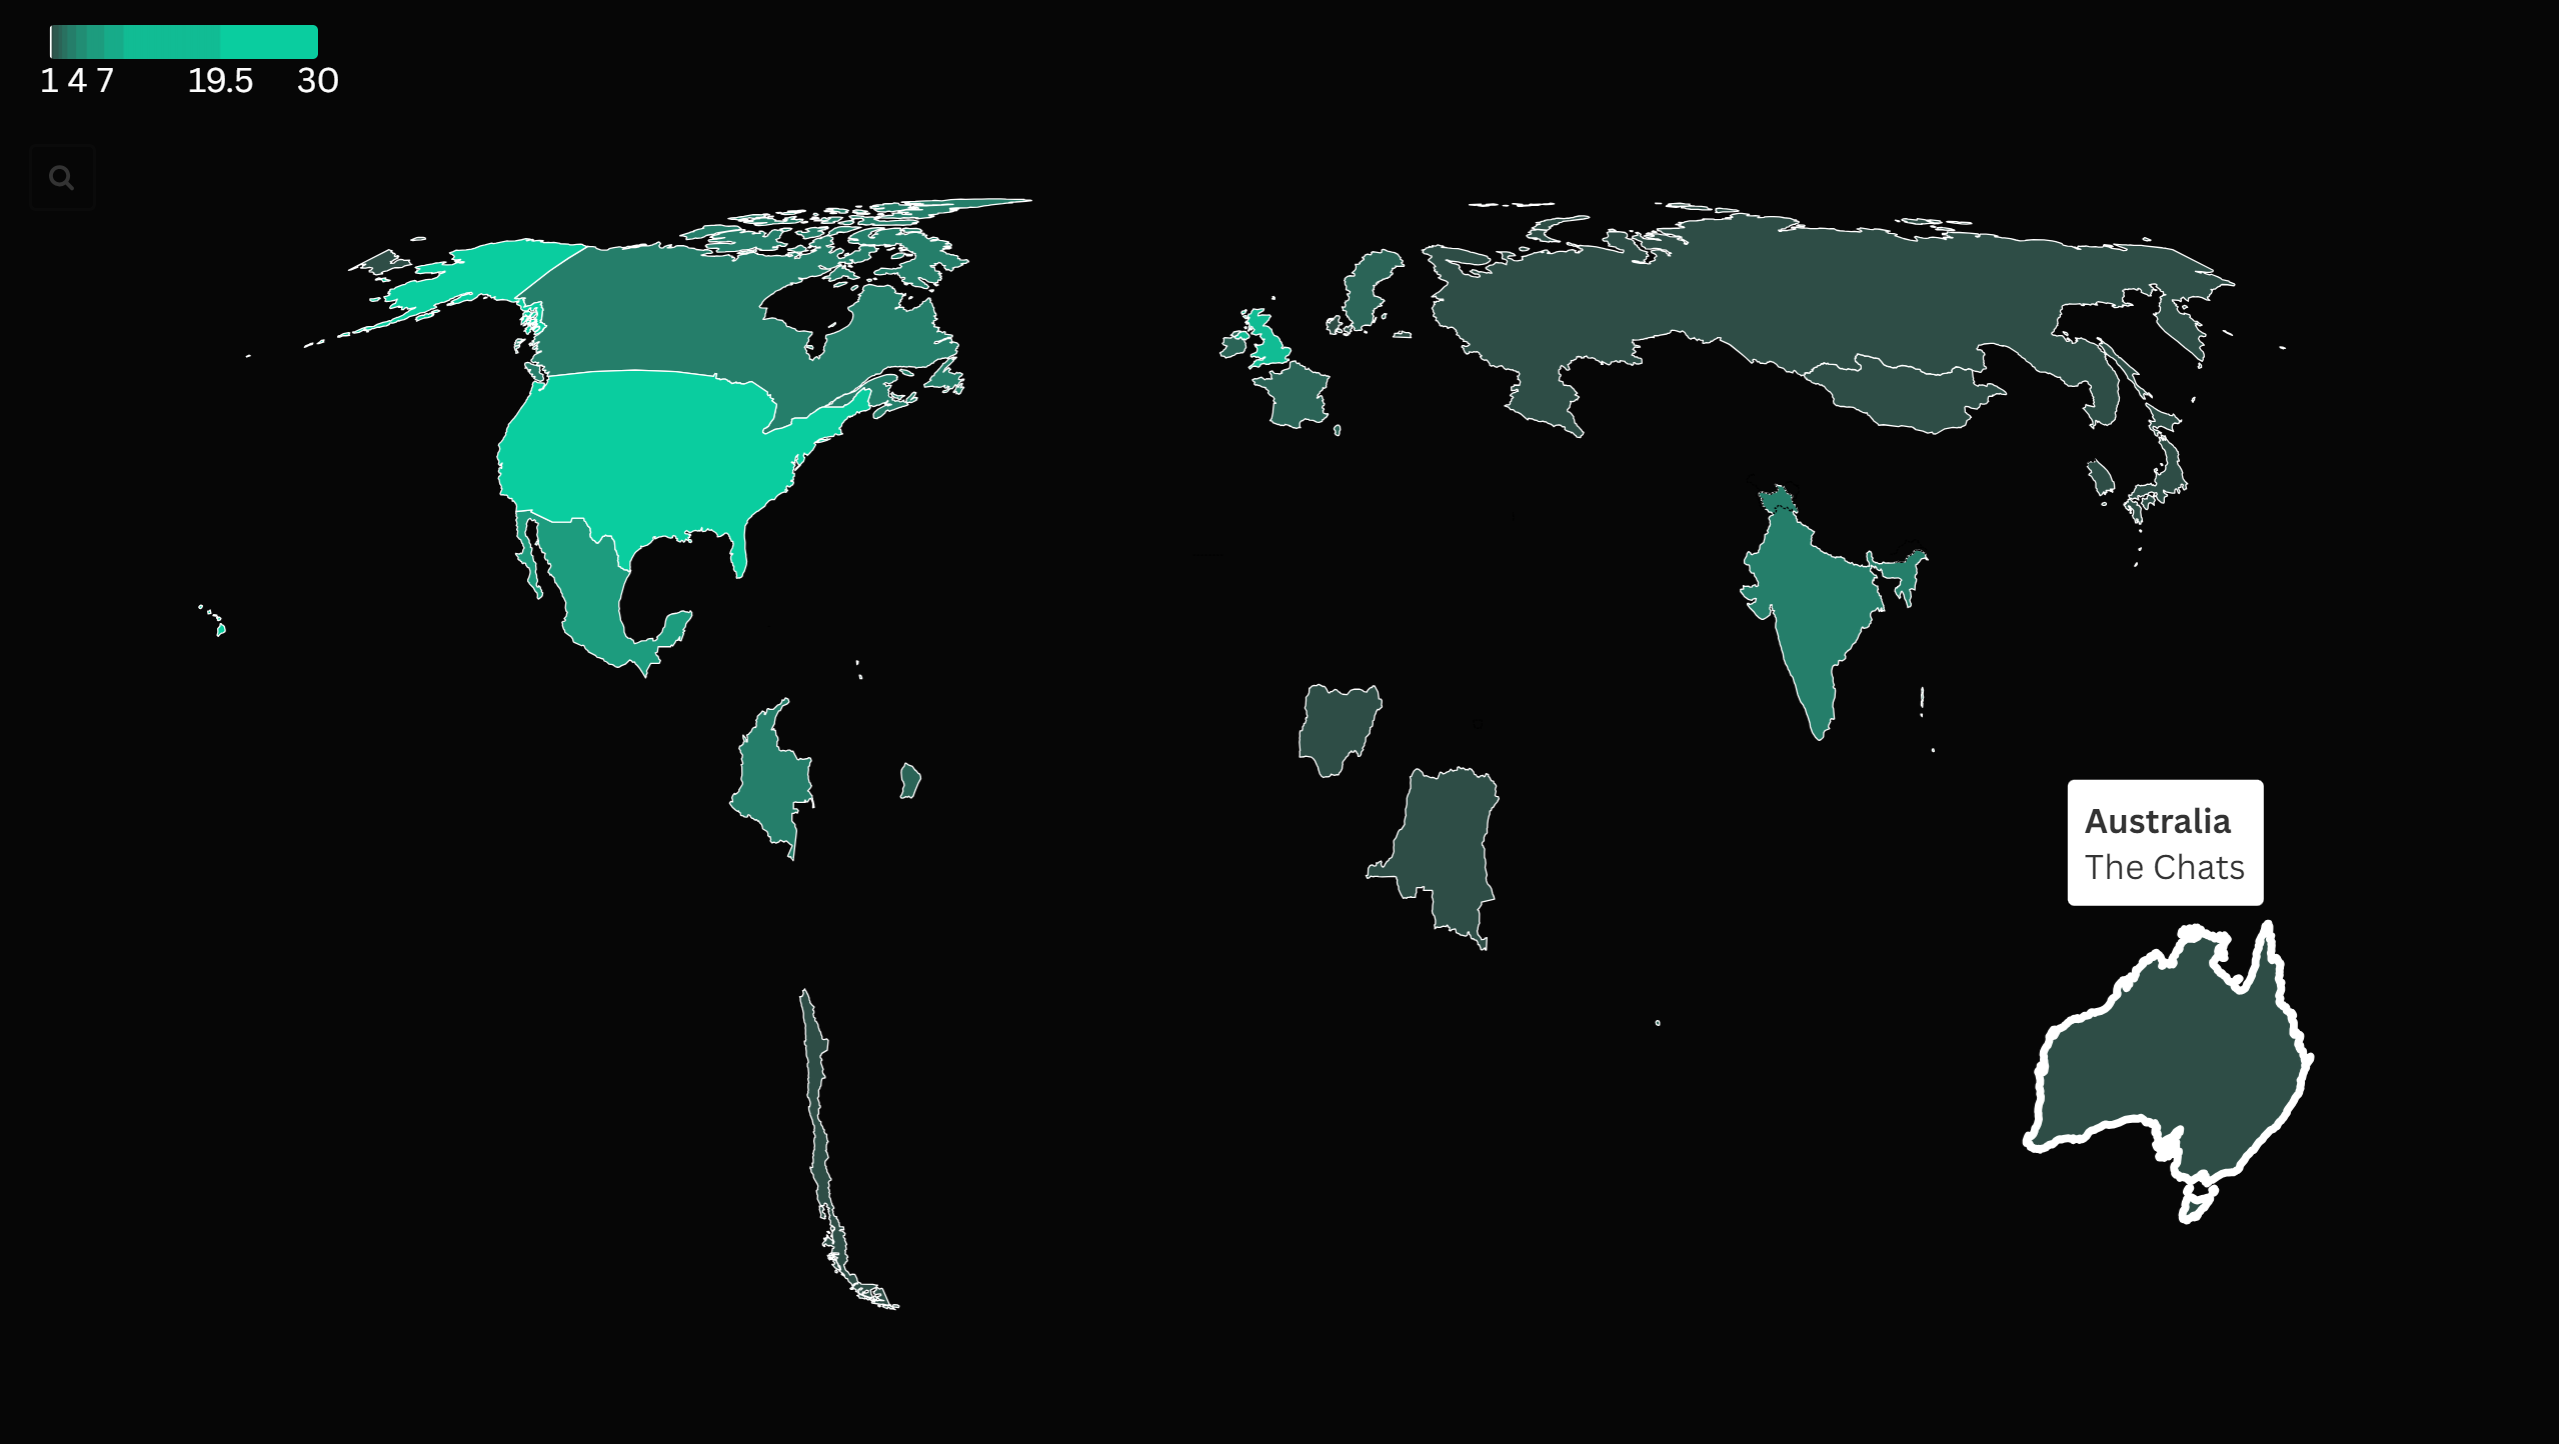
Mapping geographic orgiin
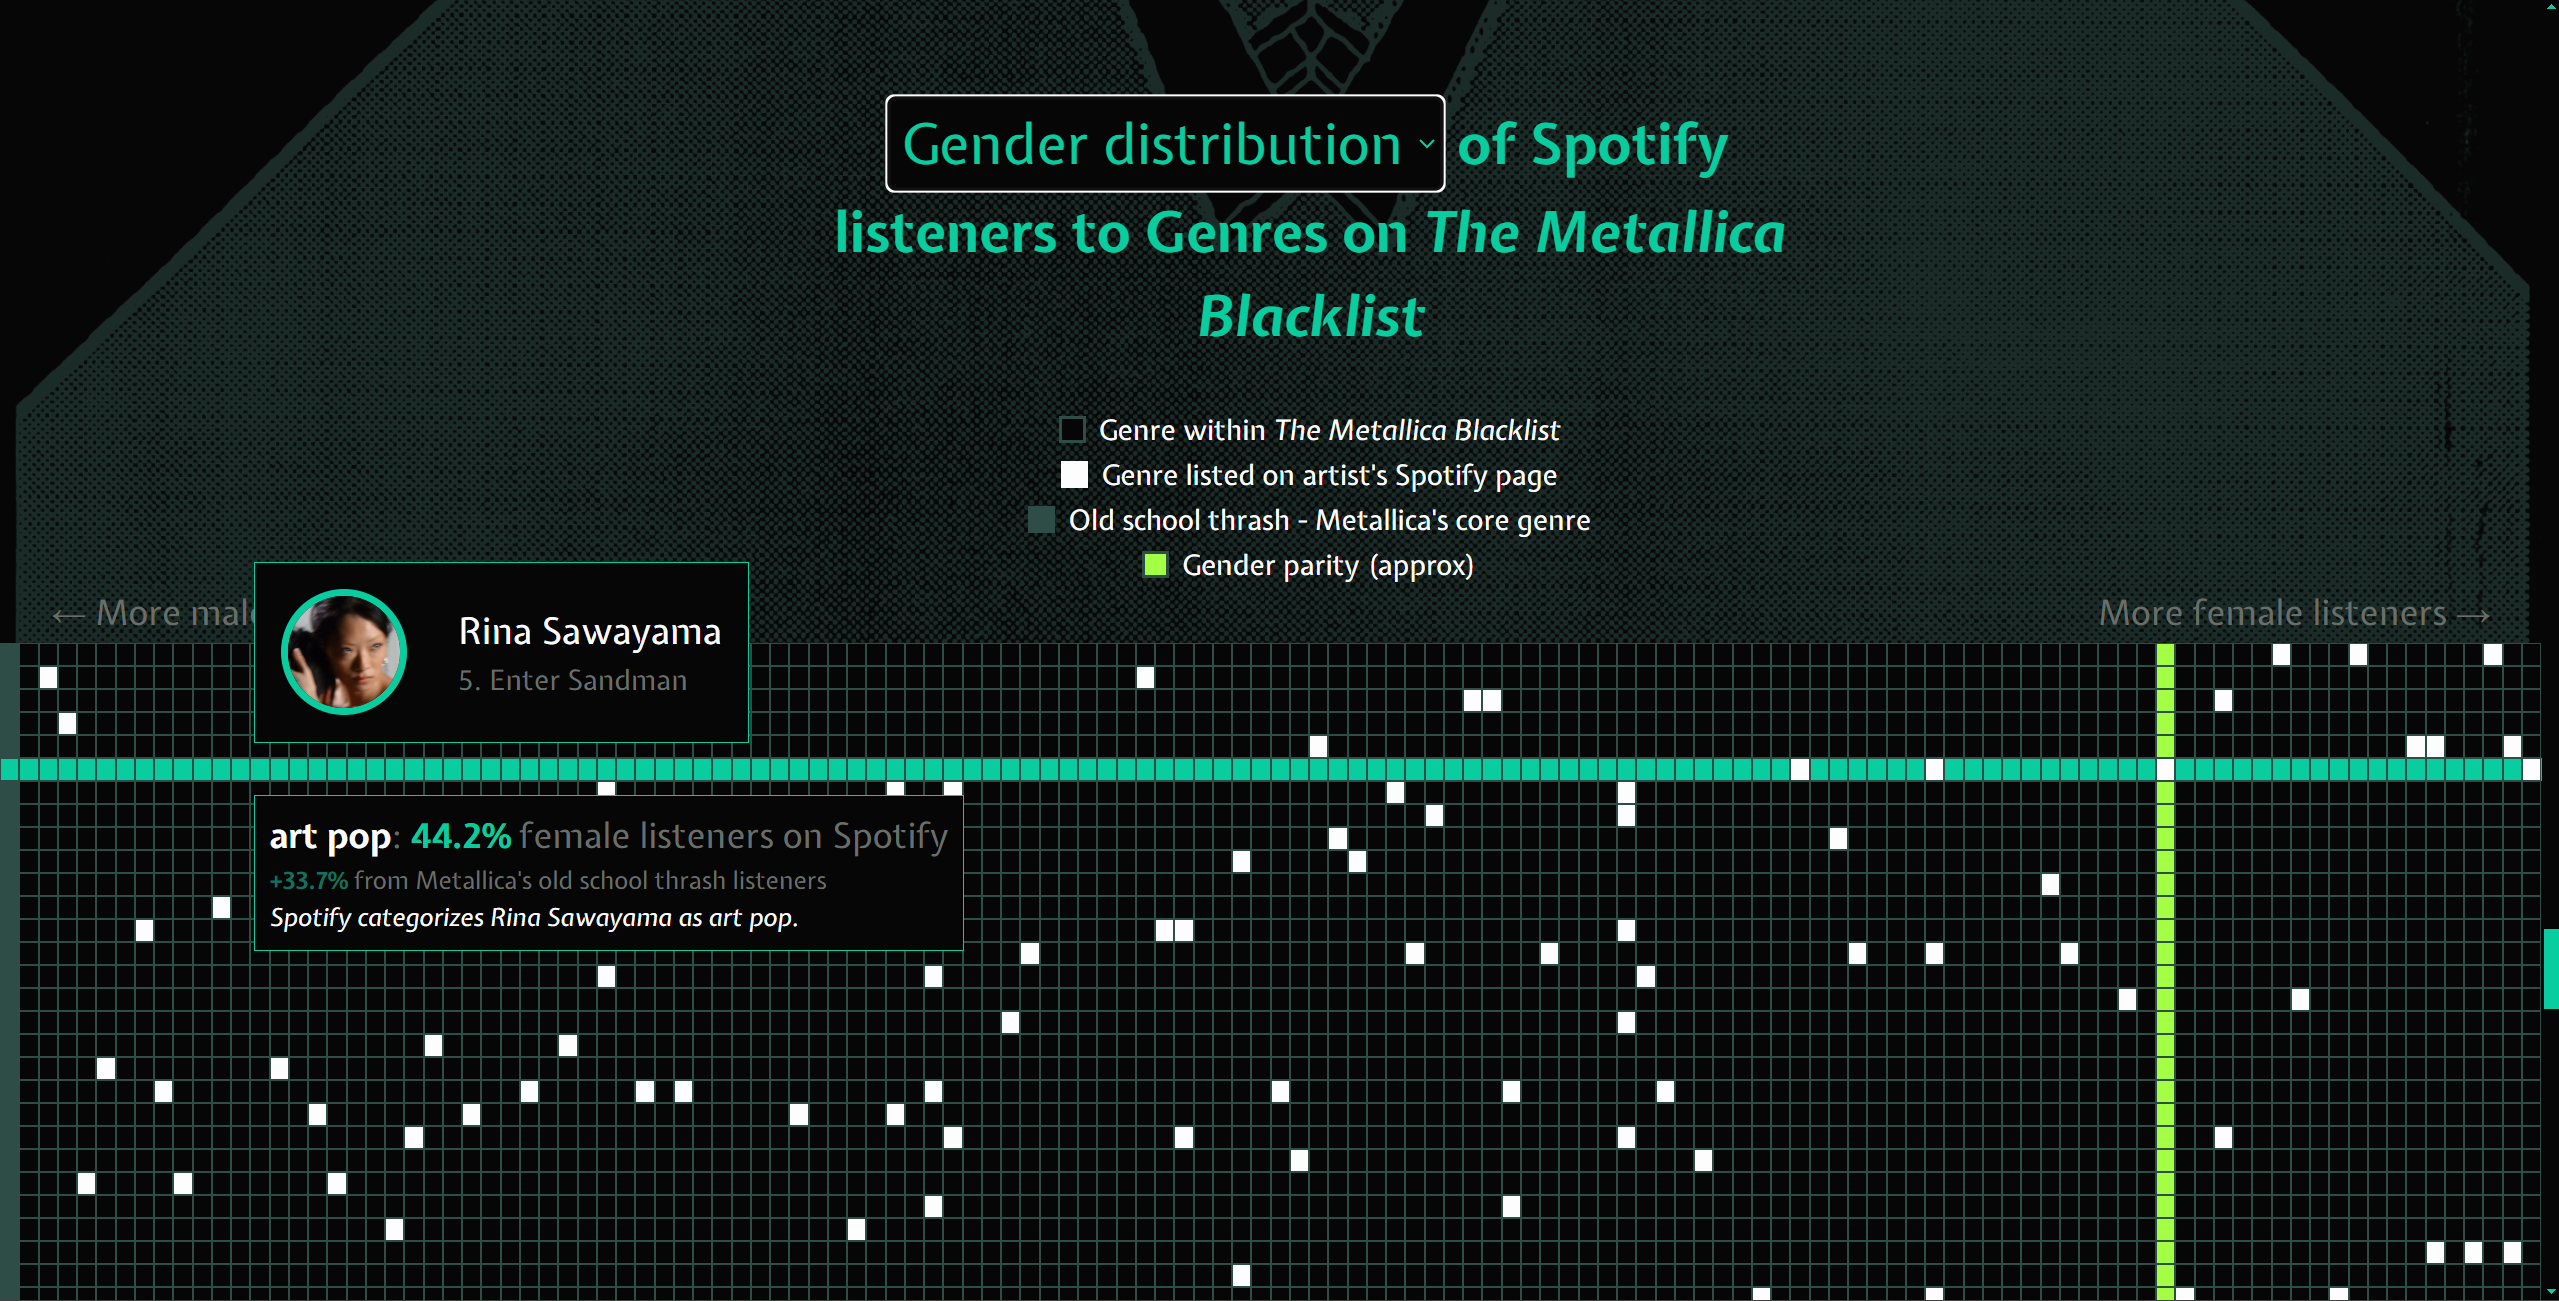
Visualizing gender/genre representation
← cd ..Built with 🤘🏻 by Caroline Dinh


