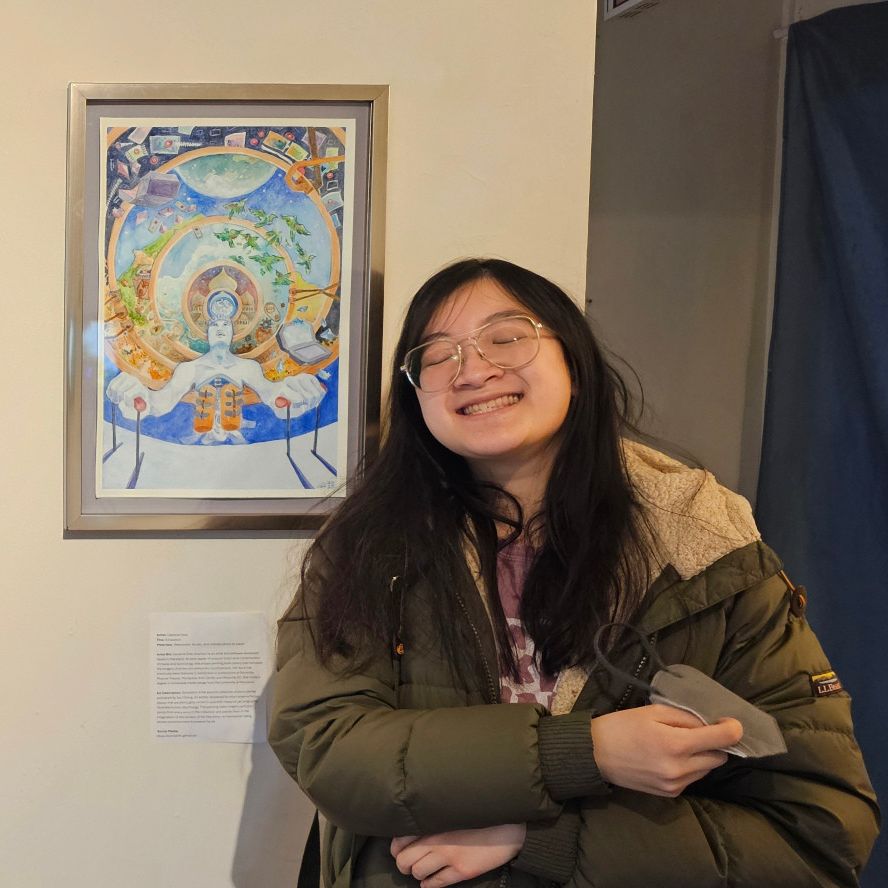
Caroline Dinh
Software developer & creative technologist
GaiaXus Web Portal
Developing a web platform for students, educators, and community scientists to explore and share water quality data.
Role: Full-stack developer, UI designer
Organization: GaiaXus, Inc. (Early-stage startup)
Tech stack: AWS Lambda, S3, DynamoDB, GraphQL, React.js, Next.js, TypeScript, Mapbox
Approaches: SaaS, data modeling, data visualization, mapping, frontend, web
Challenge & Impact
As the sole full-time developer in an early-stage startup, my challenge was to transform their prototype web app into a usable, scalable SaaS platform from architecture to implementation. My work carried the output of a $250,000 SBIR Phase 1 grant and was tested by hundreds of educational users around the country. Alongside software development, I was responsible for training educators how to use our technology in their classroom lessons, and my interactions with the teachers shaped the features that went into the product.
Features I shipped
Data review and visualization
I refactored the database schema and indexes for more efficient filtering, and re-designed the user interface which was previously built for our engineers. Now, customers can log into the platform and easily identify and review their data.
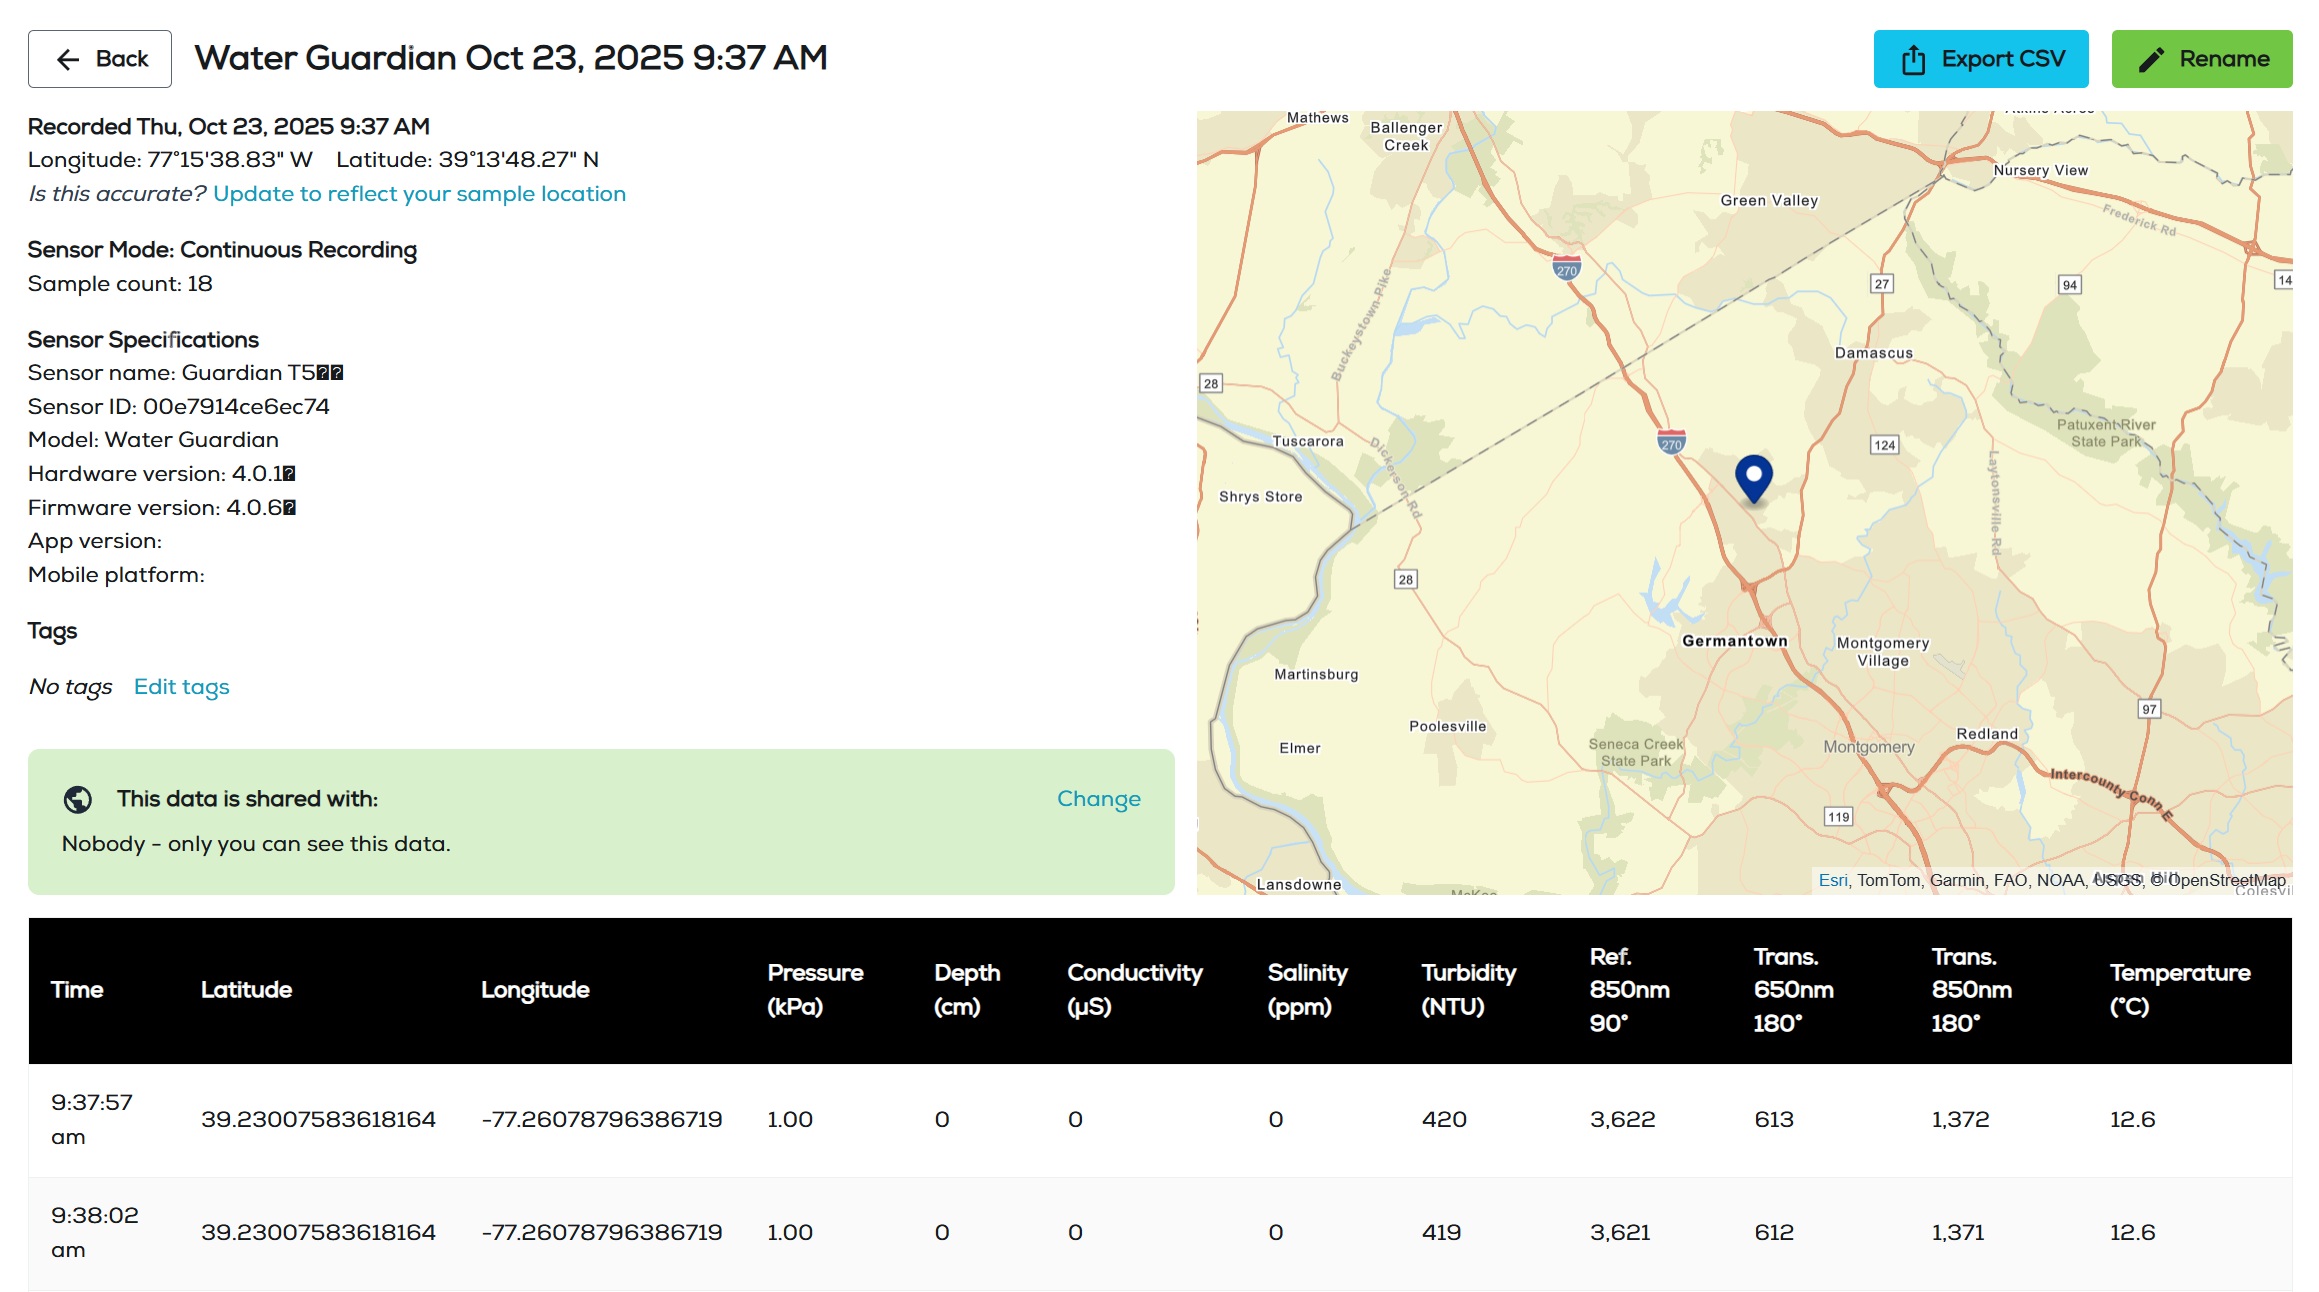
Data review interface
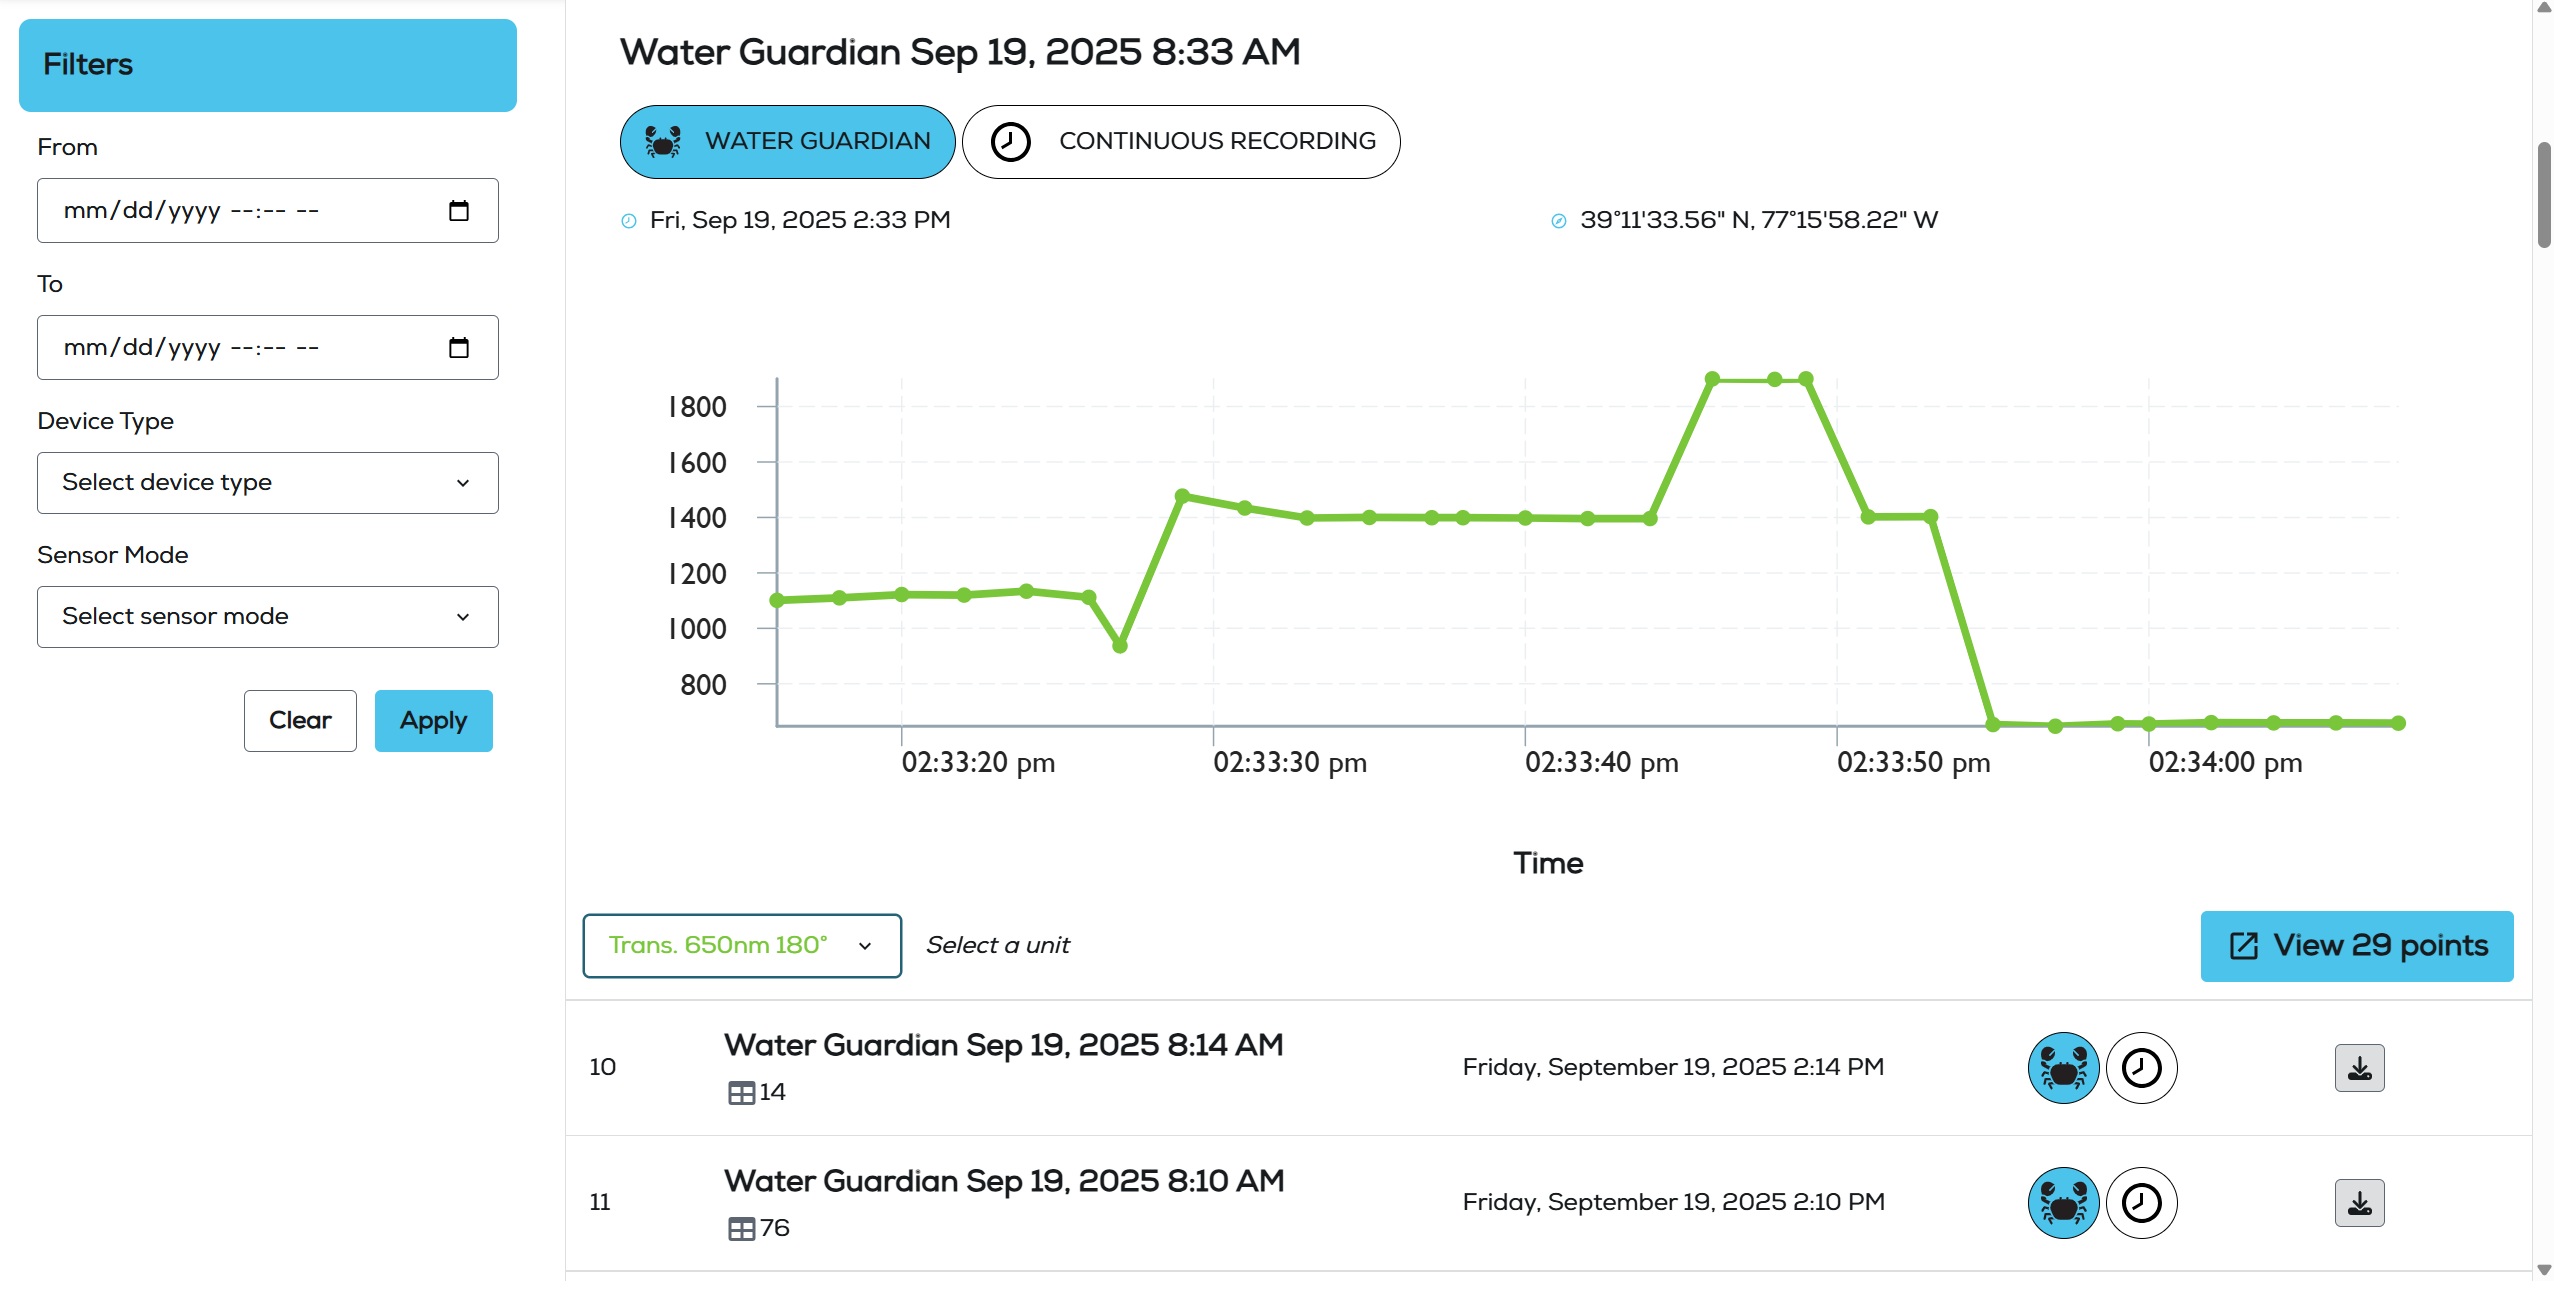
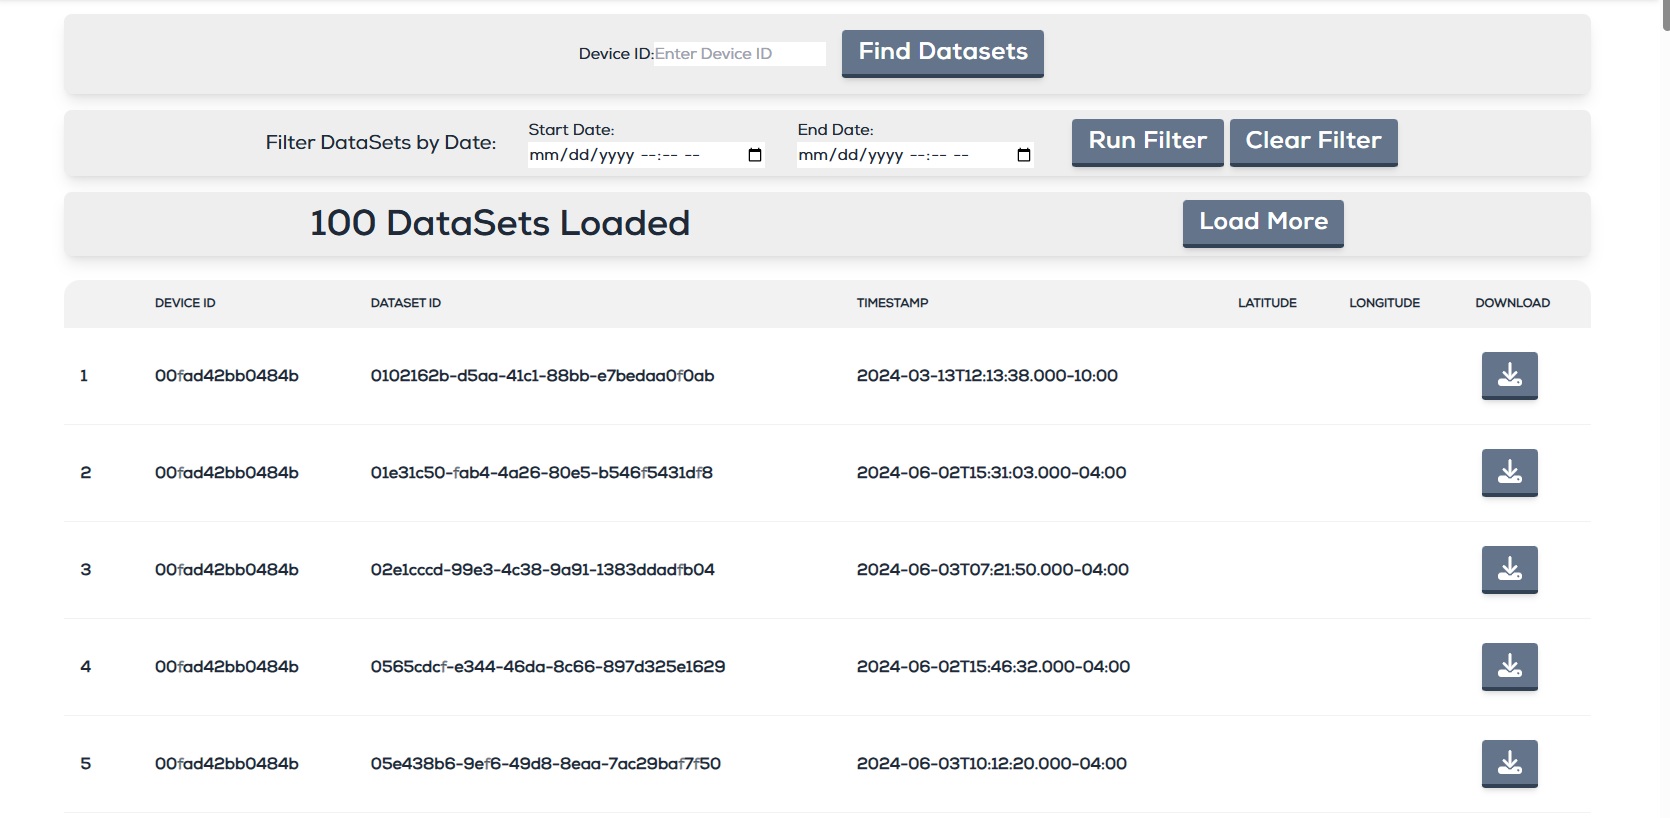
Comparison - data filtering interface before (right) and after
Version-controlled, AI-powered instructional modules
I refactored the backend architecture of our Labs (multimedia instructional modules) to handle version control and more efficient file storage and built an interface to view submissions. I also shipped a RAG/LLM integration called the Navigator, which looks up verified citizen science data from a third party API to help teachers build hyperlocal place-based activities, while training middle school science teachers how to use this feature in their curriculum development.
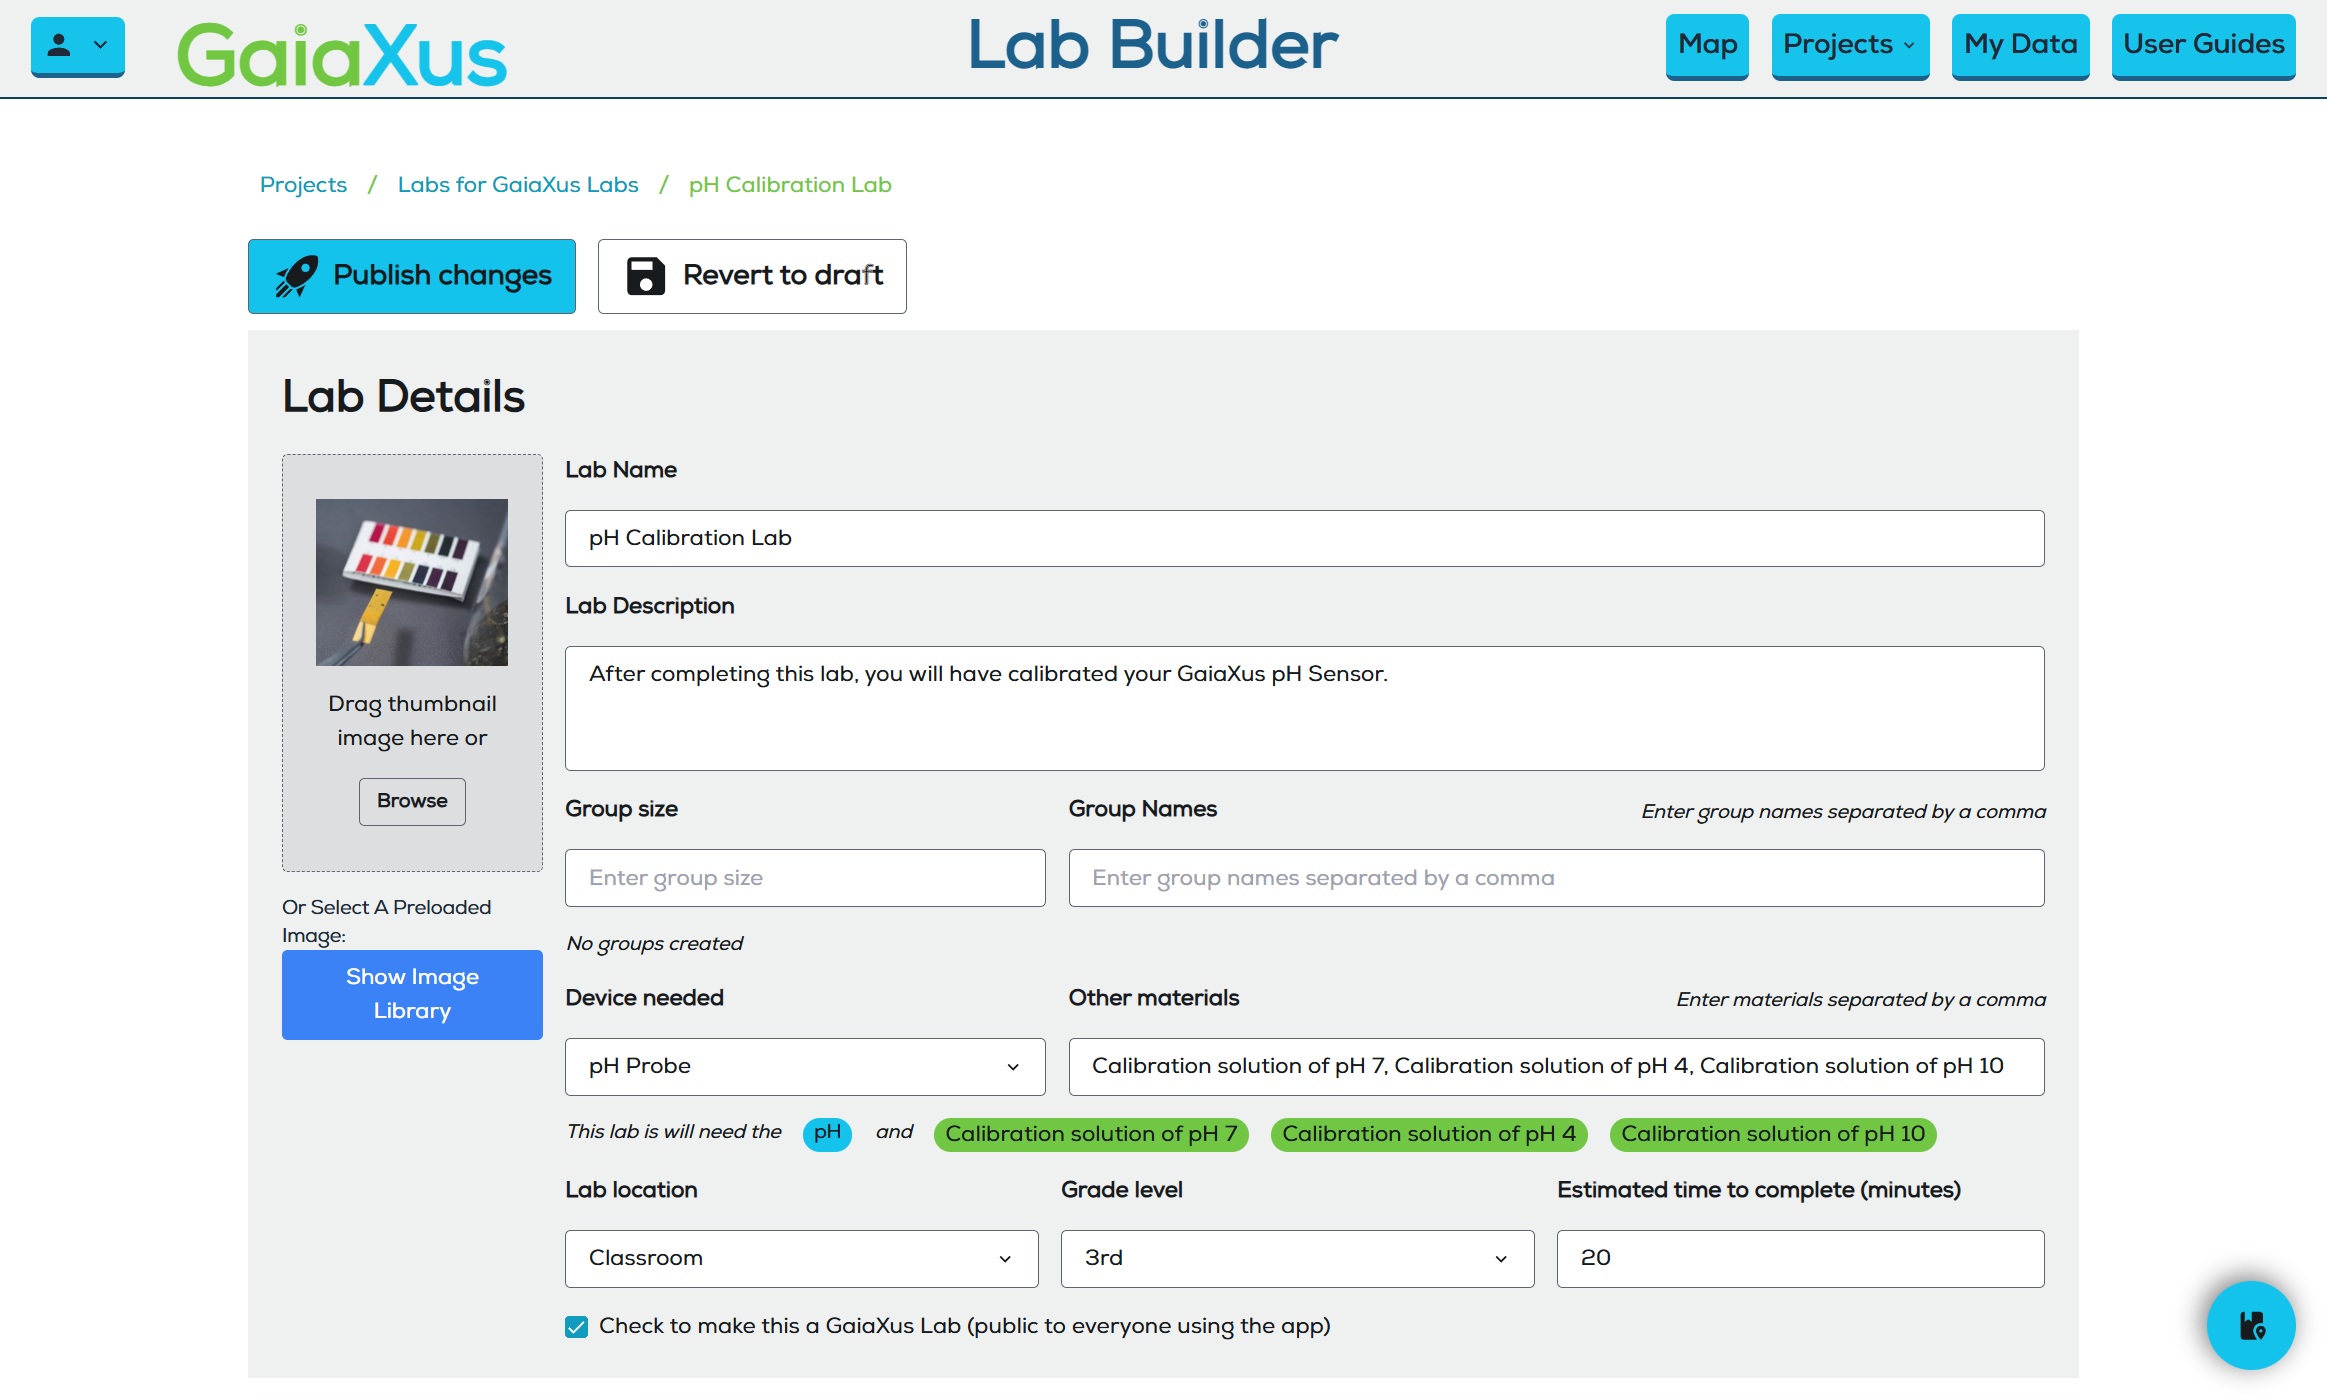
Lab builder
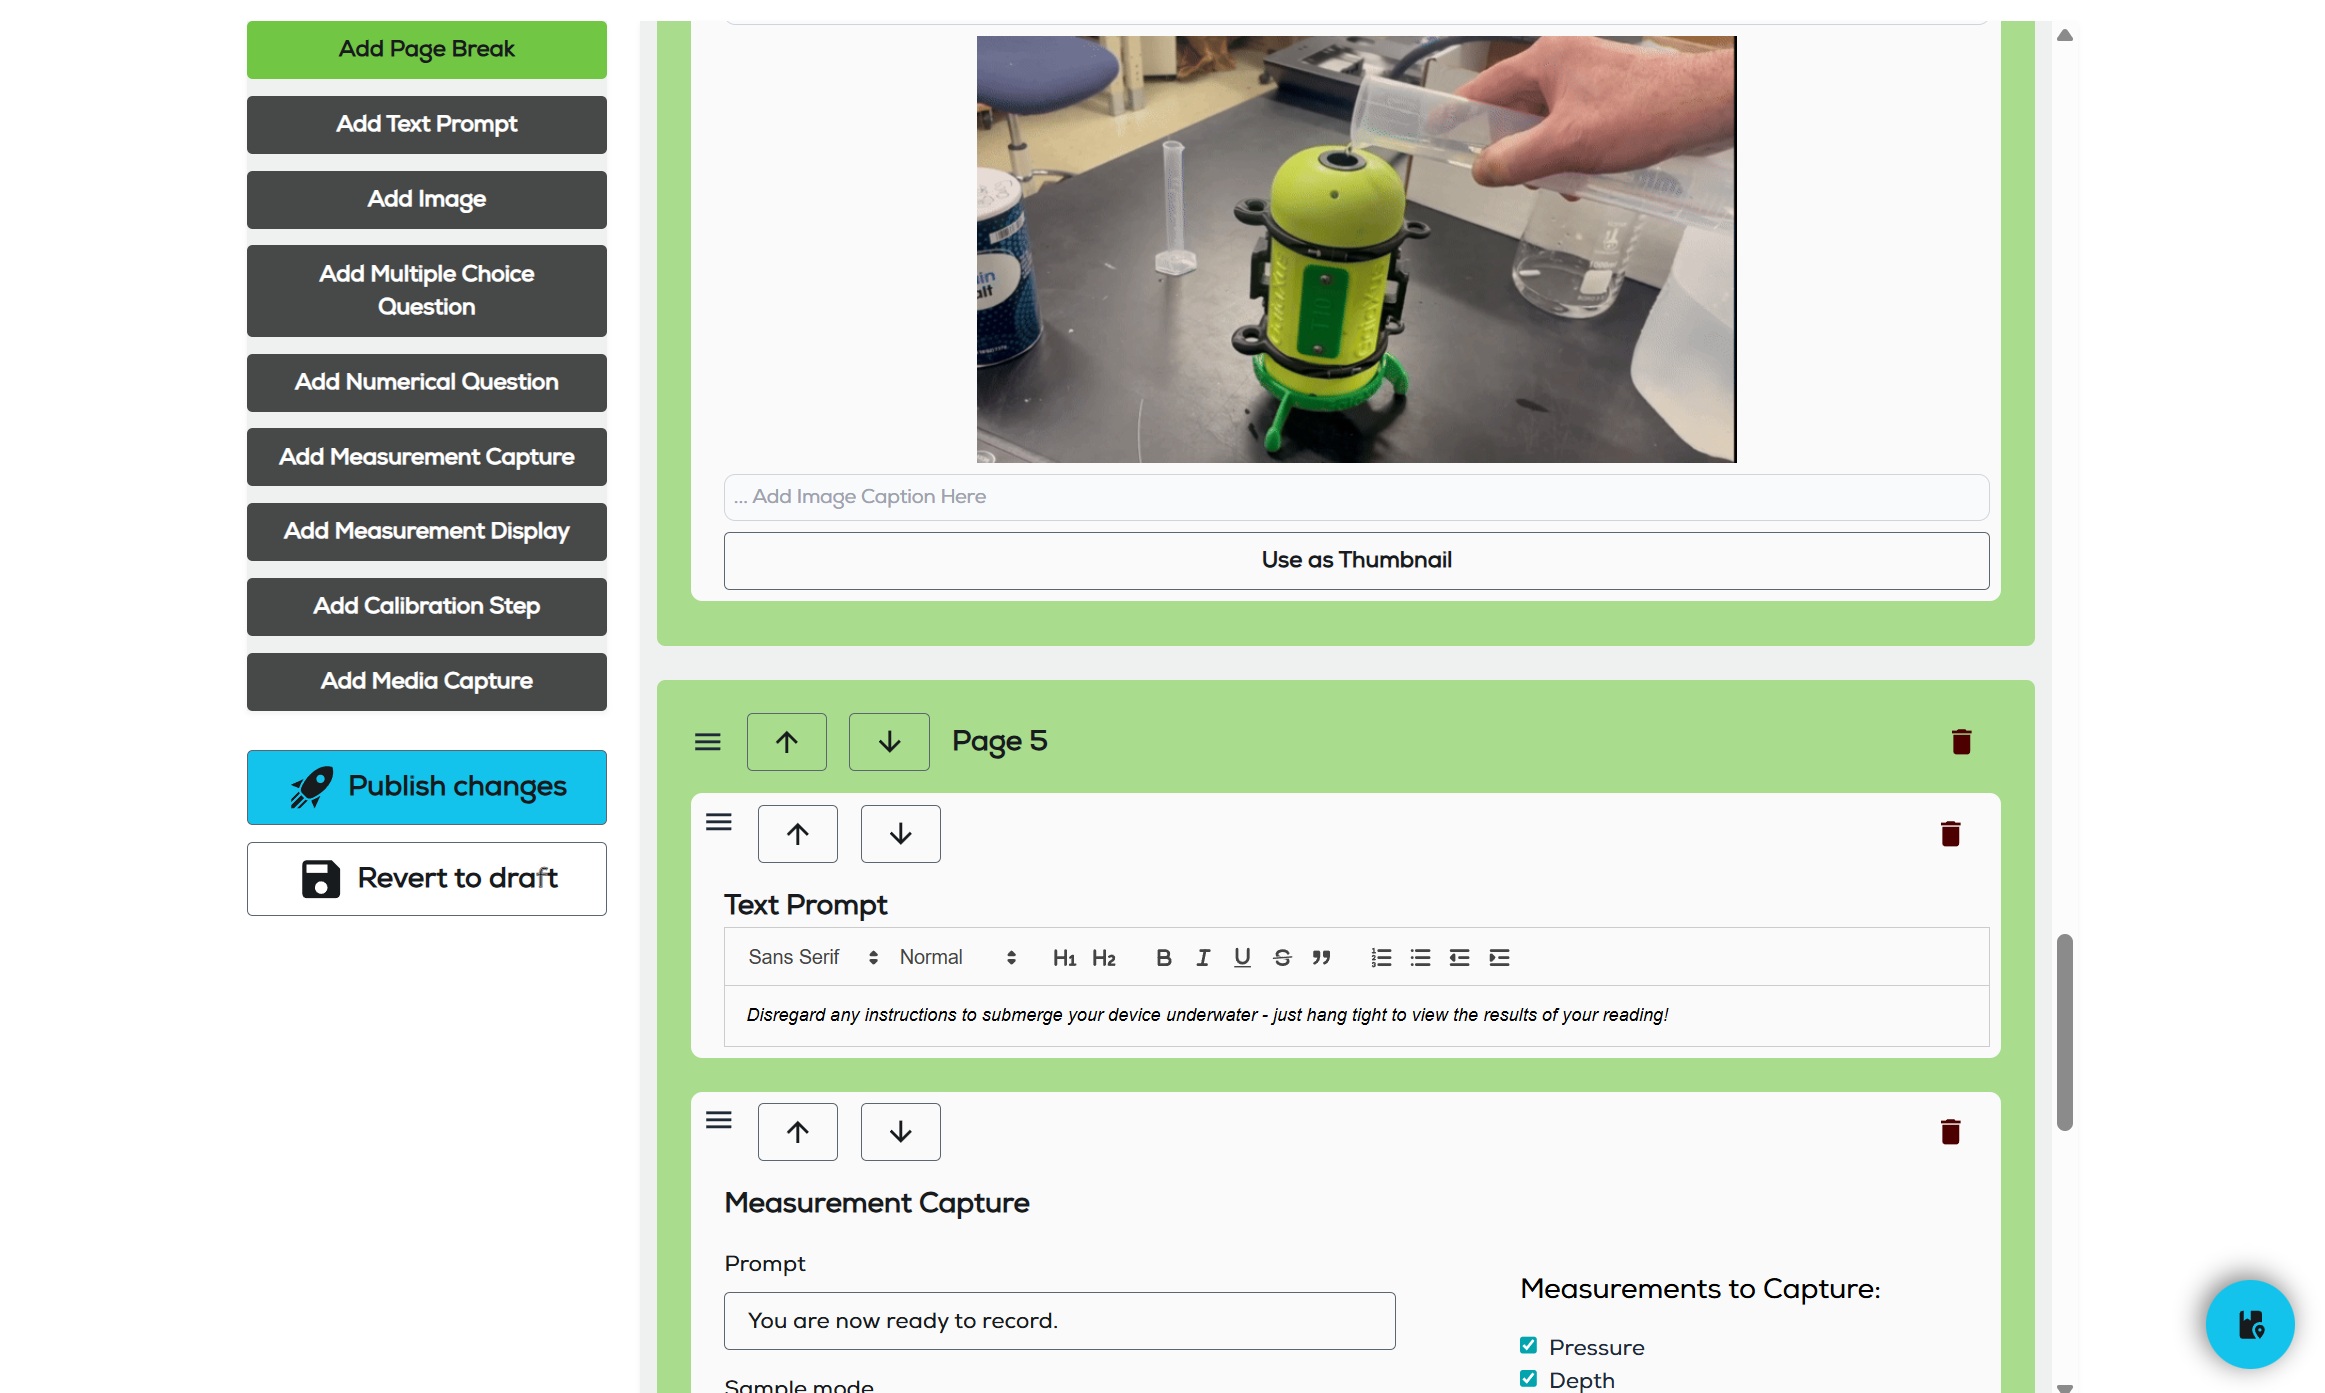
Lab builder components
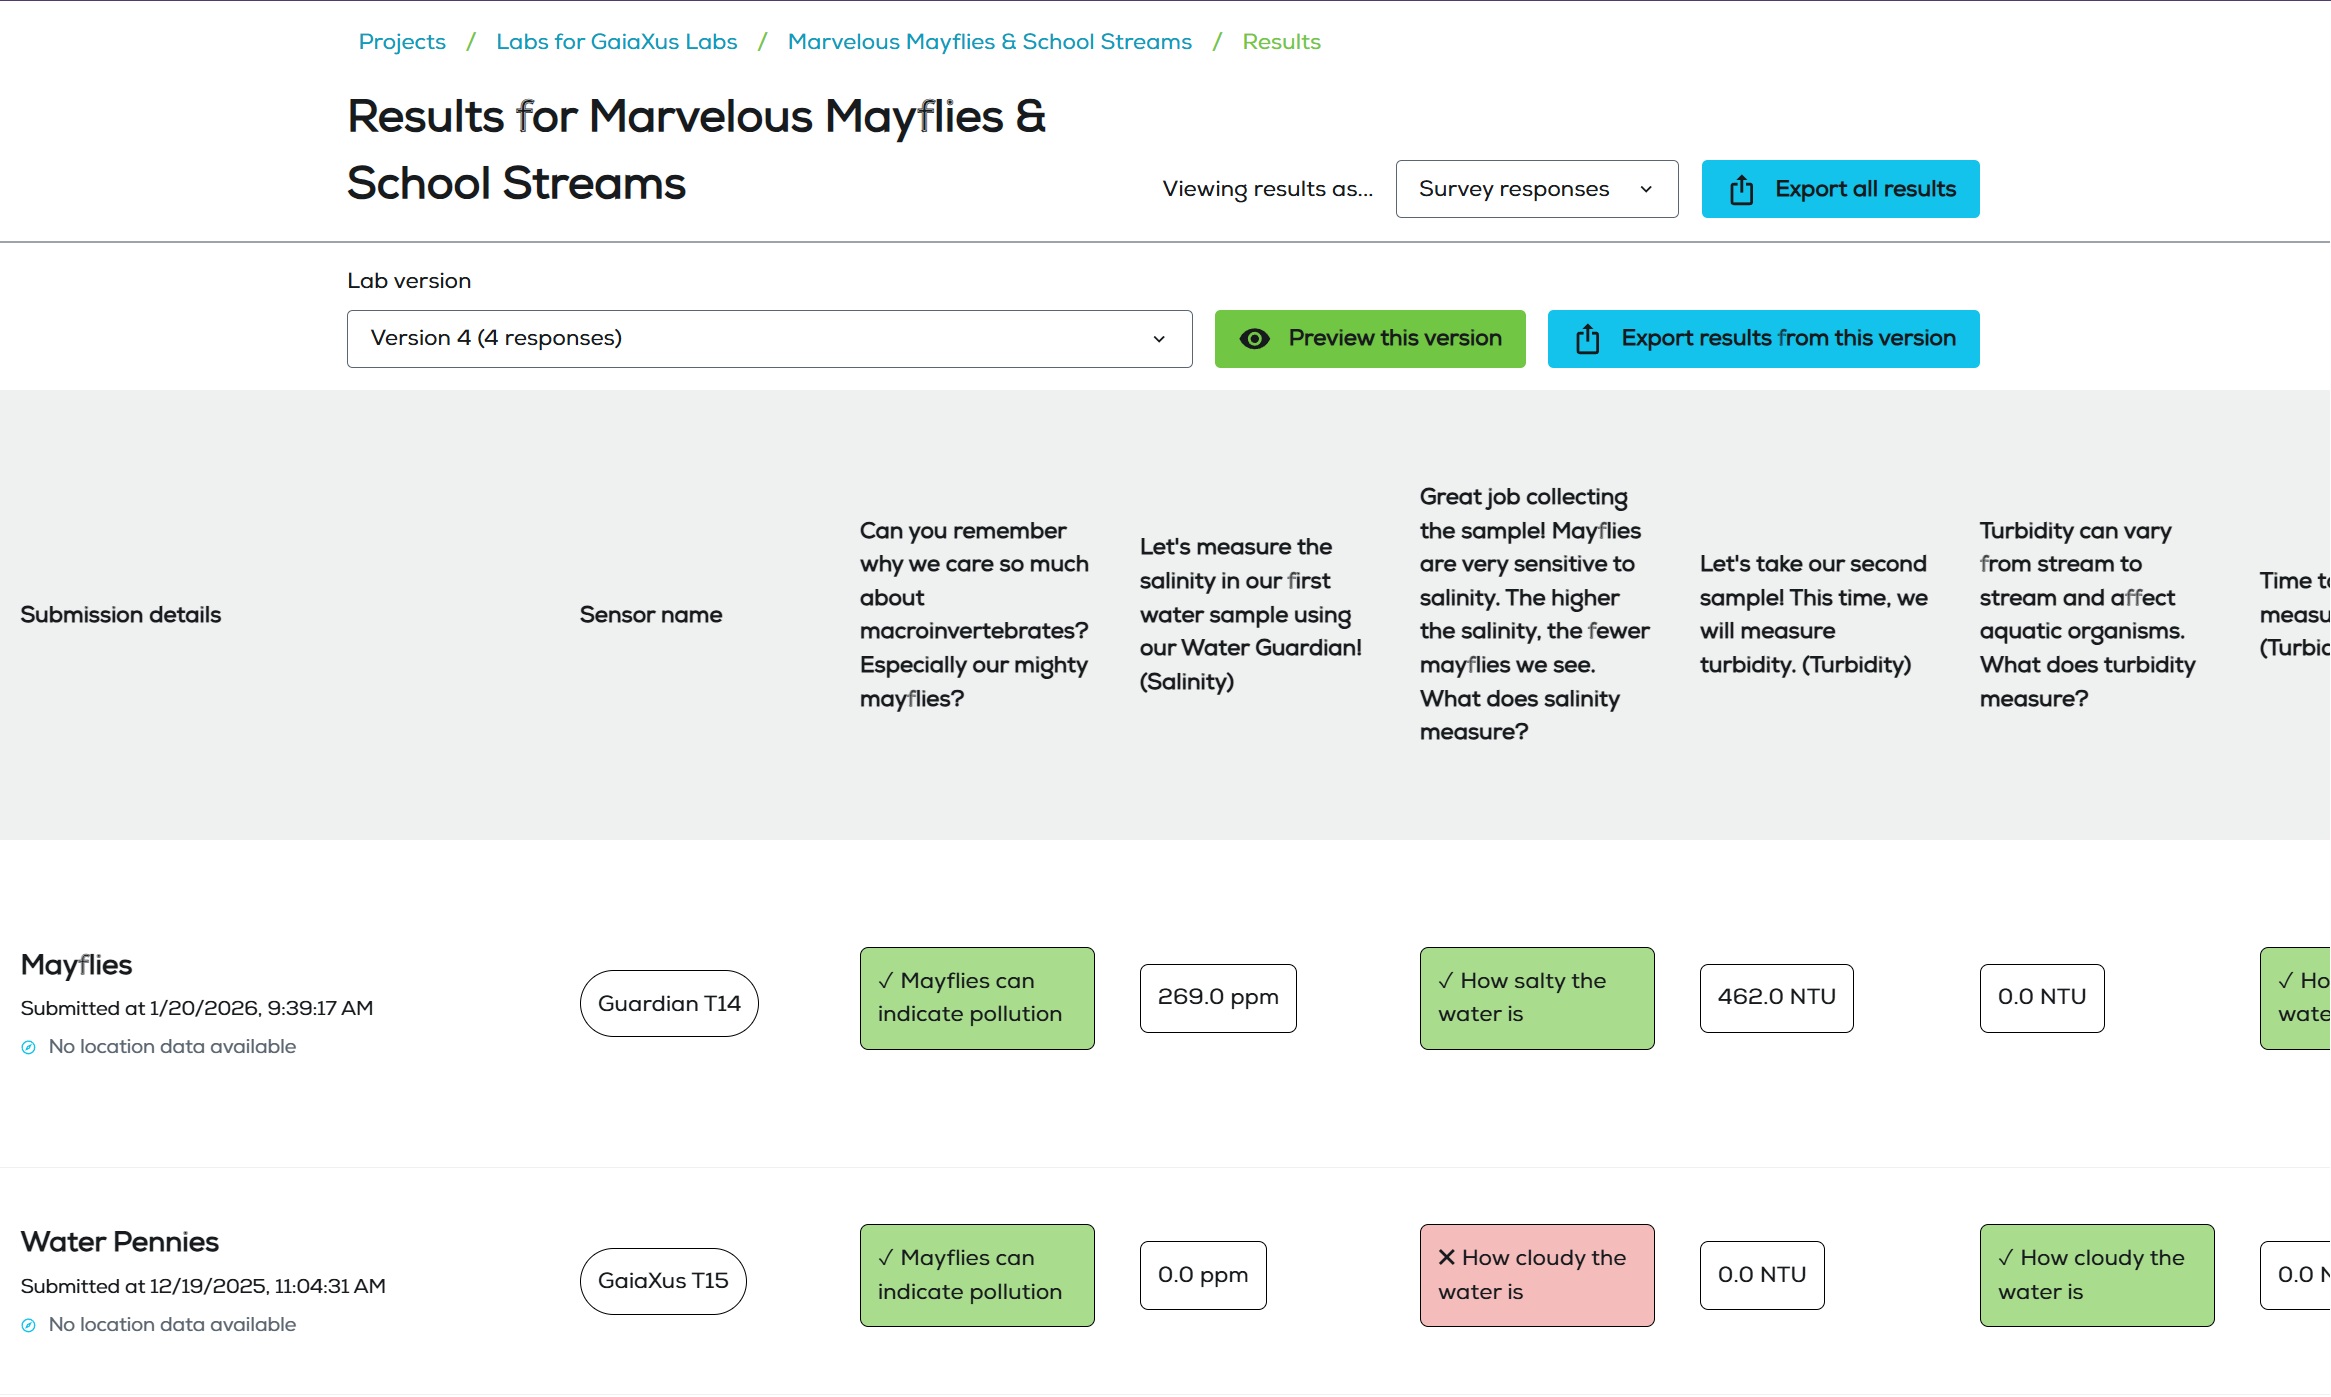
Lab result table organized by lab version
Project management for classrooms and community science
I designed the database schema and user interface for our Projects feature, allowing classroom and community science groups to collaborate on data and workflows.
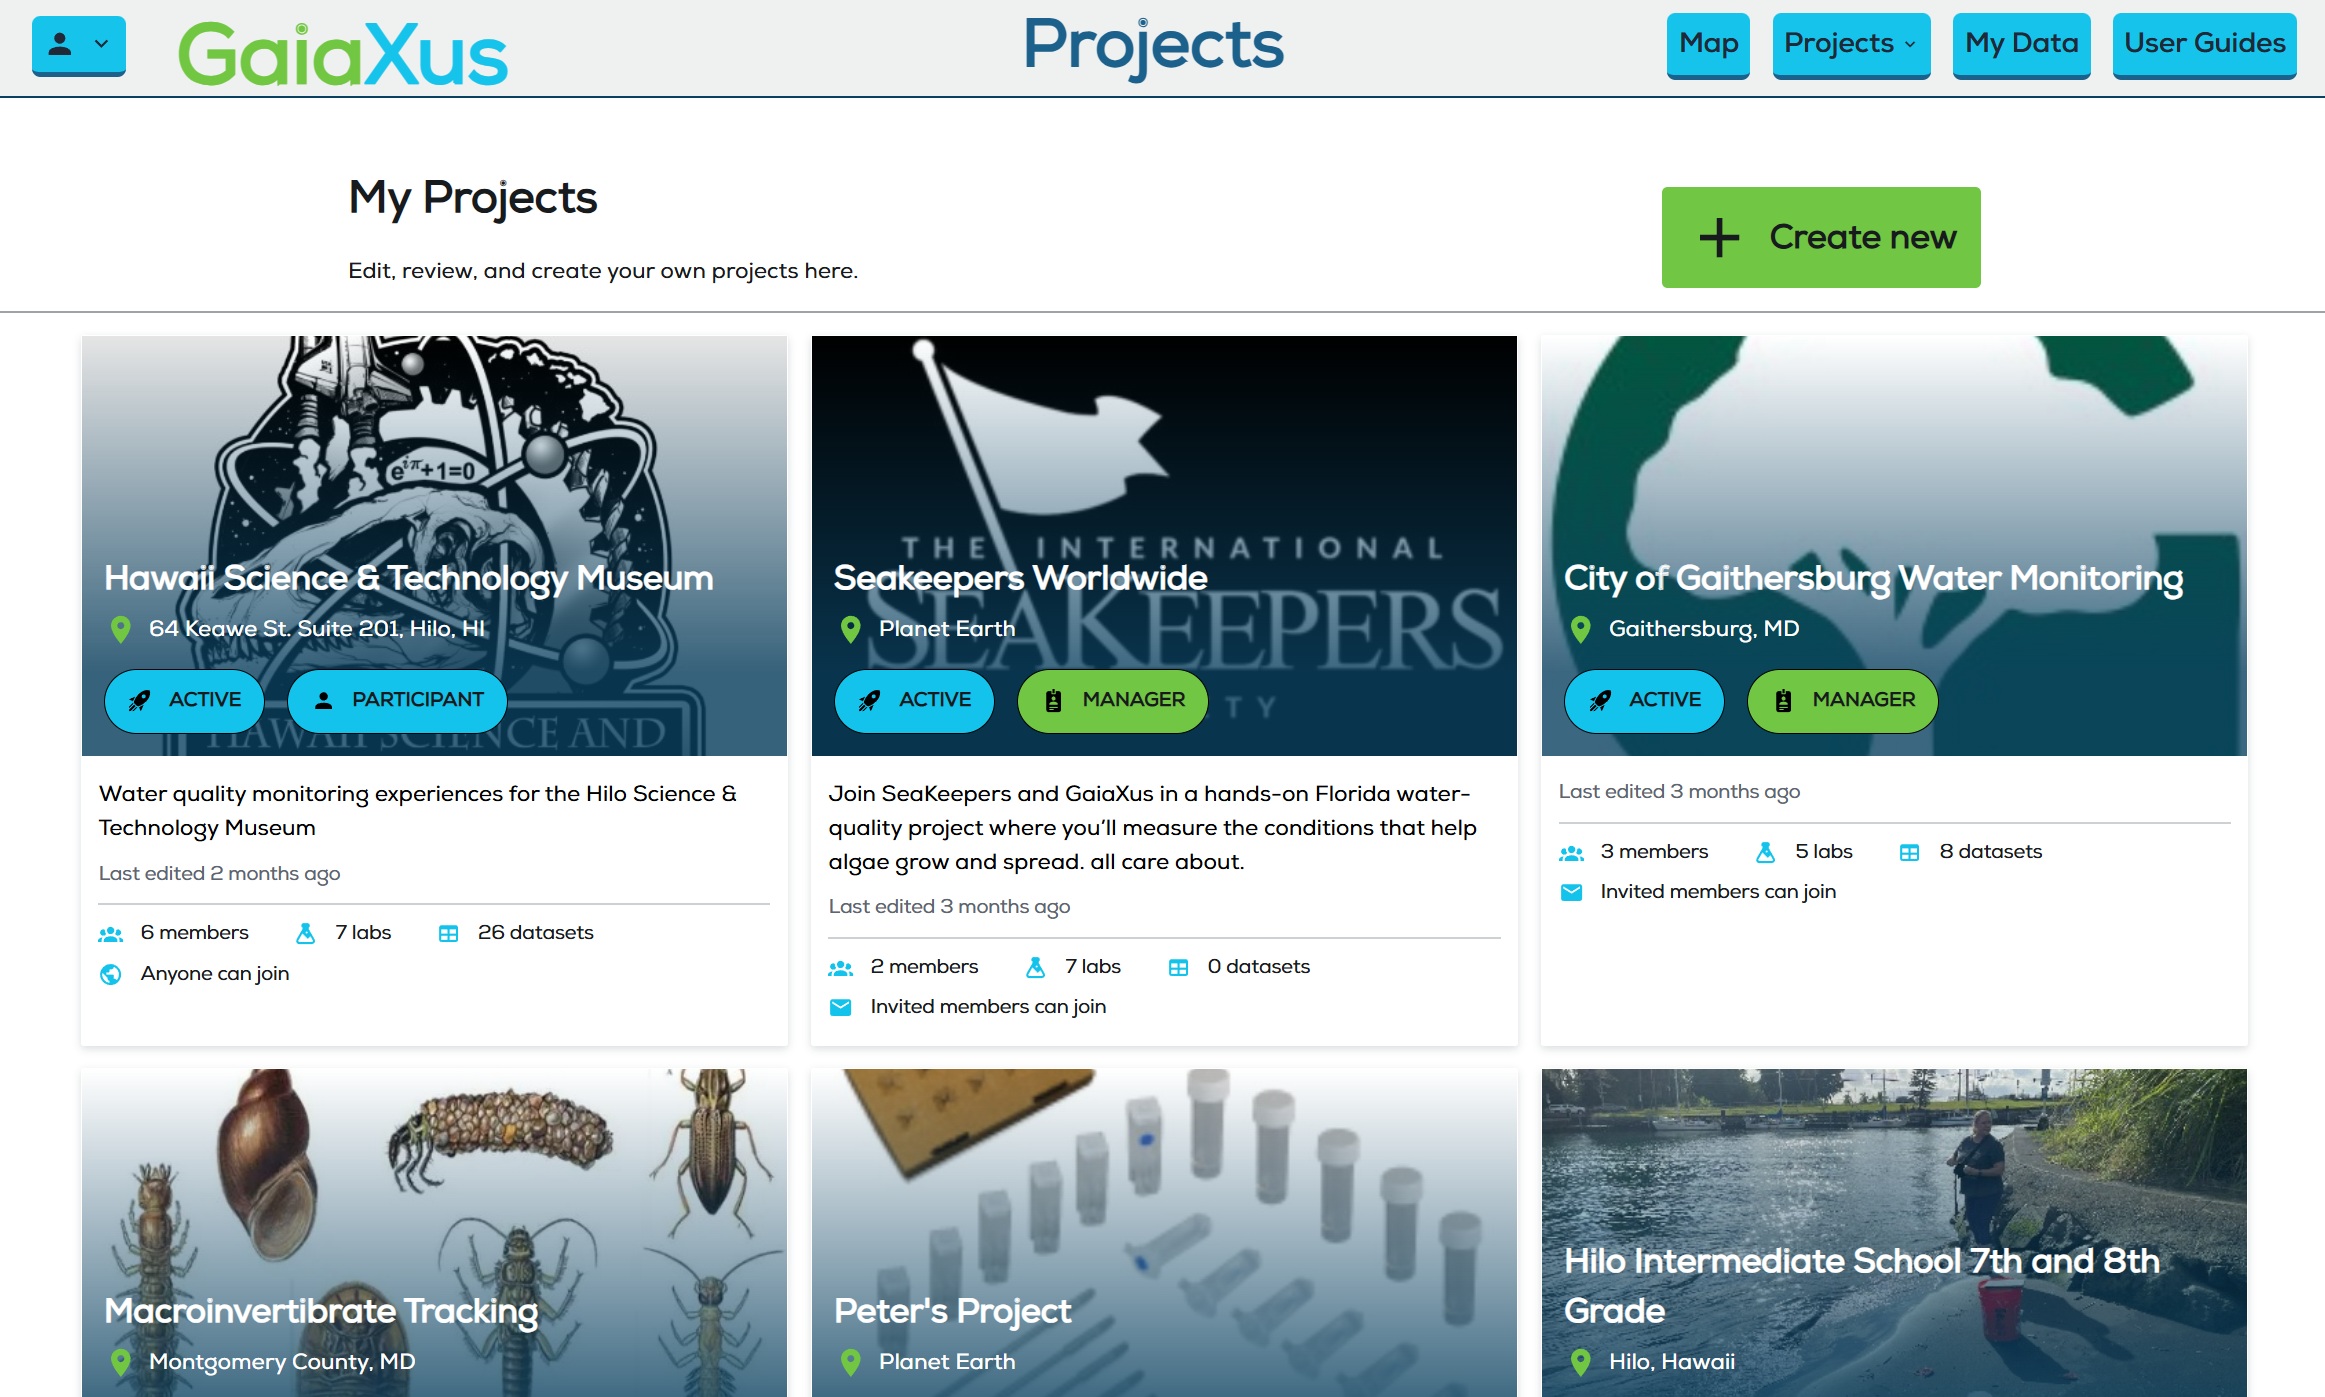
Card-based project list
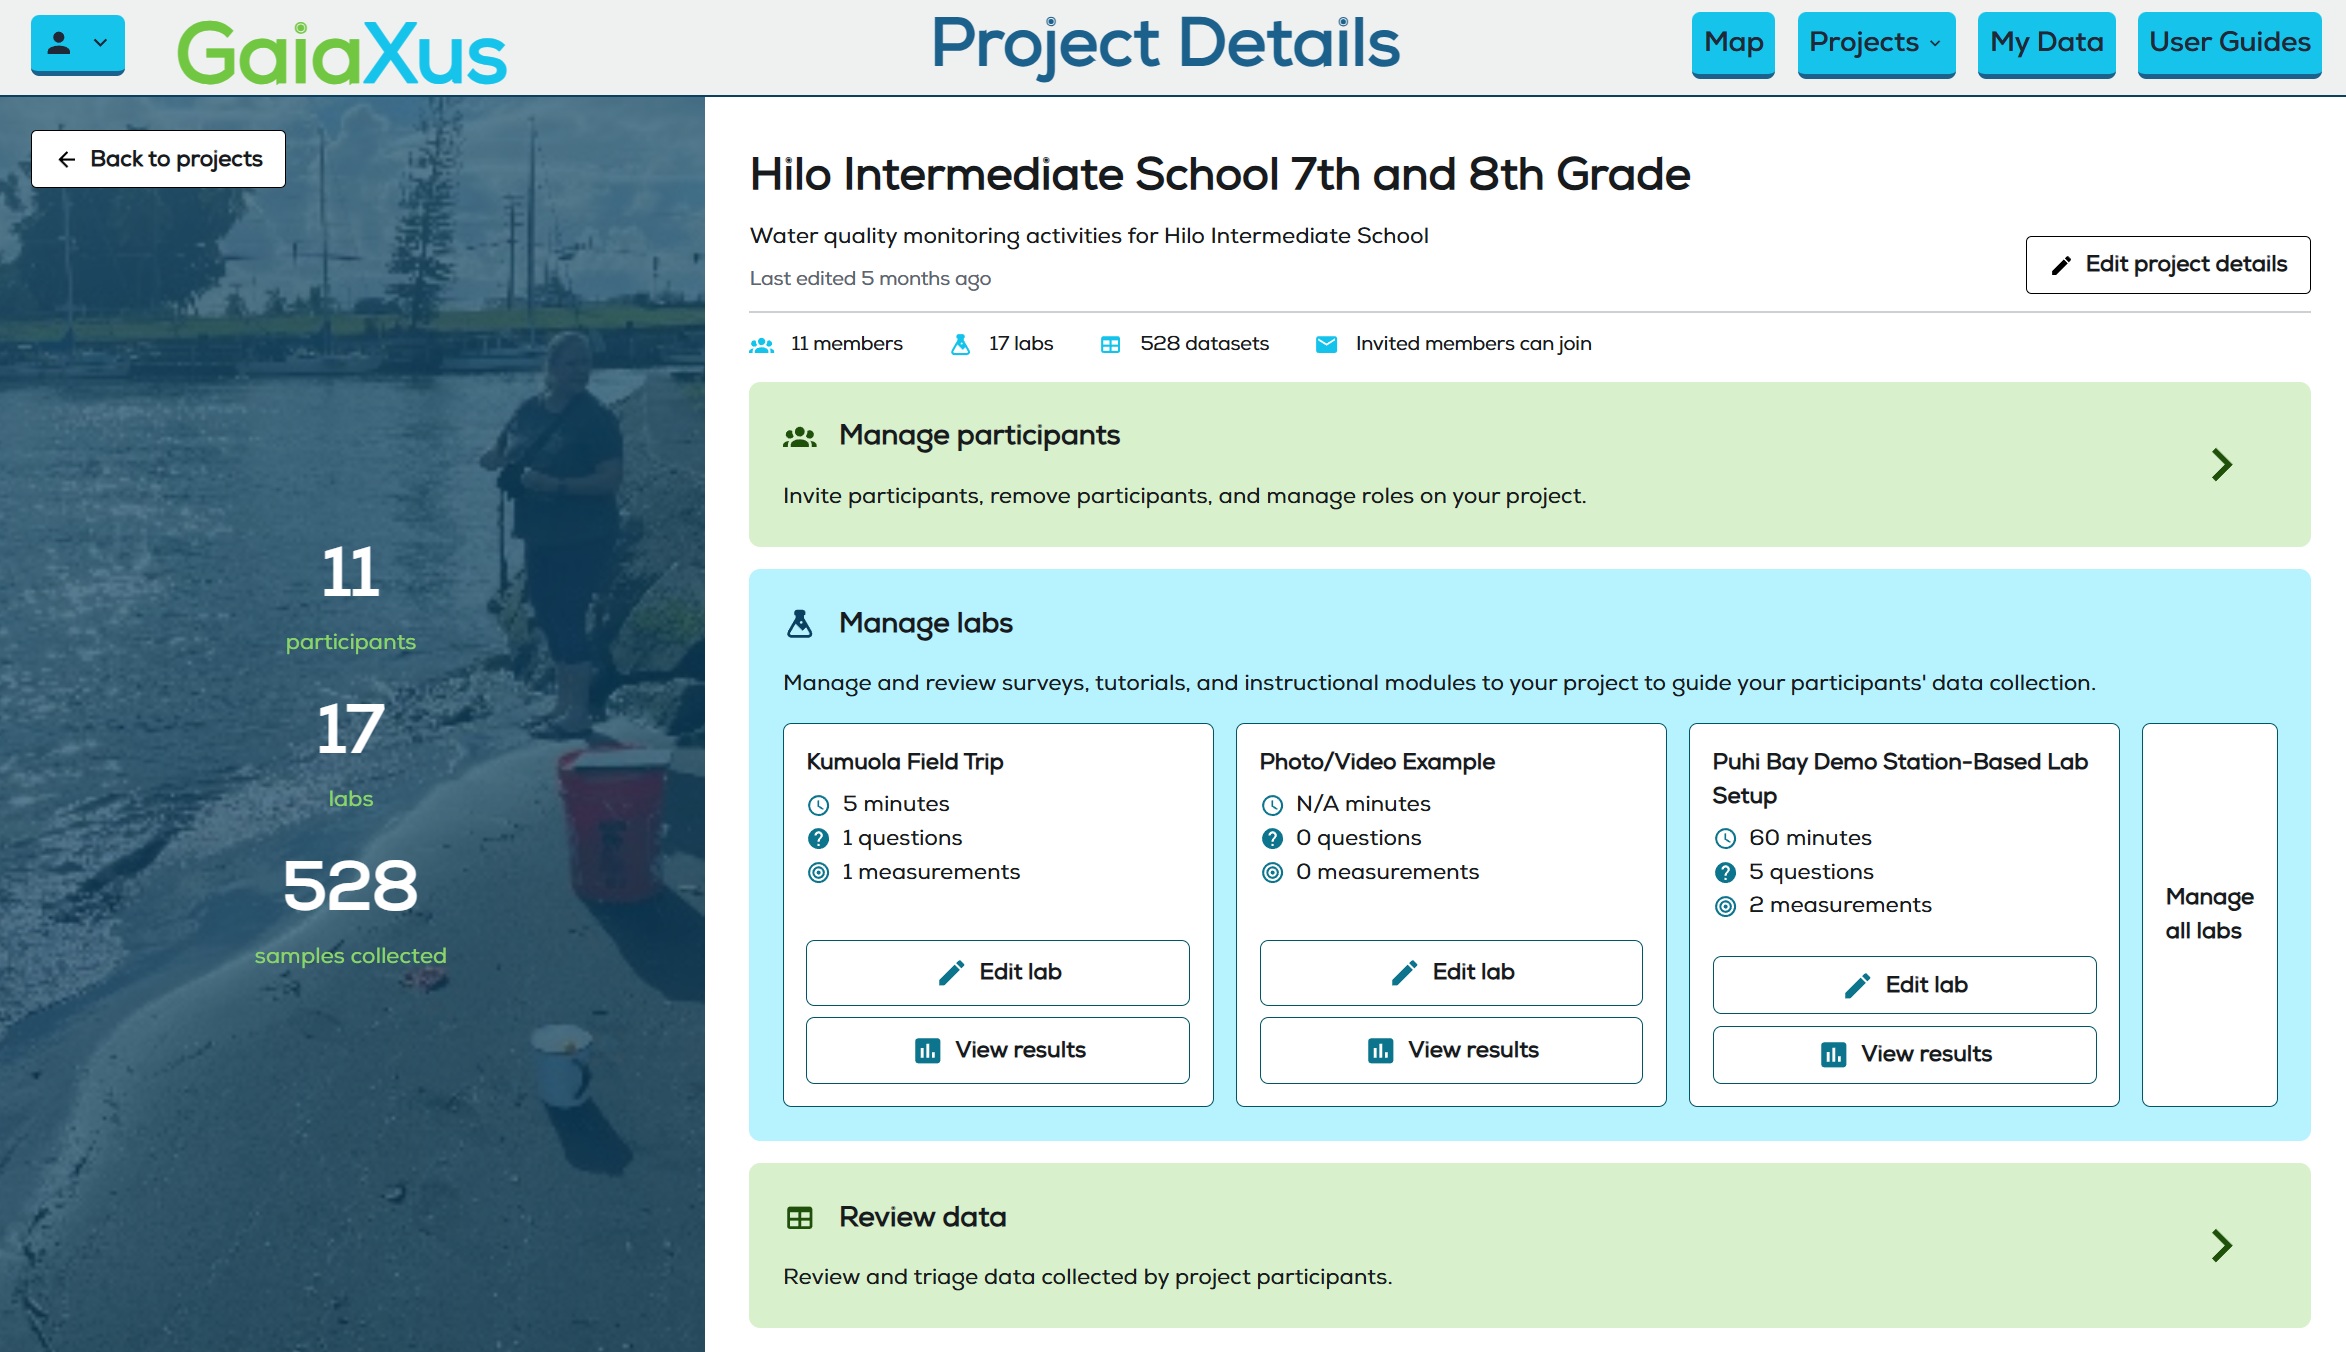
Project detail page
Interactive data mapping
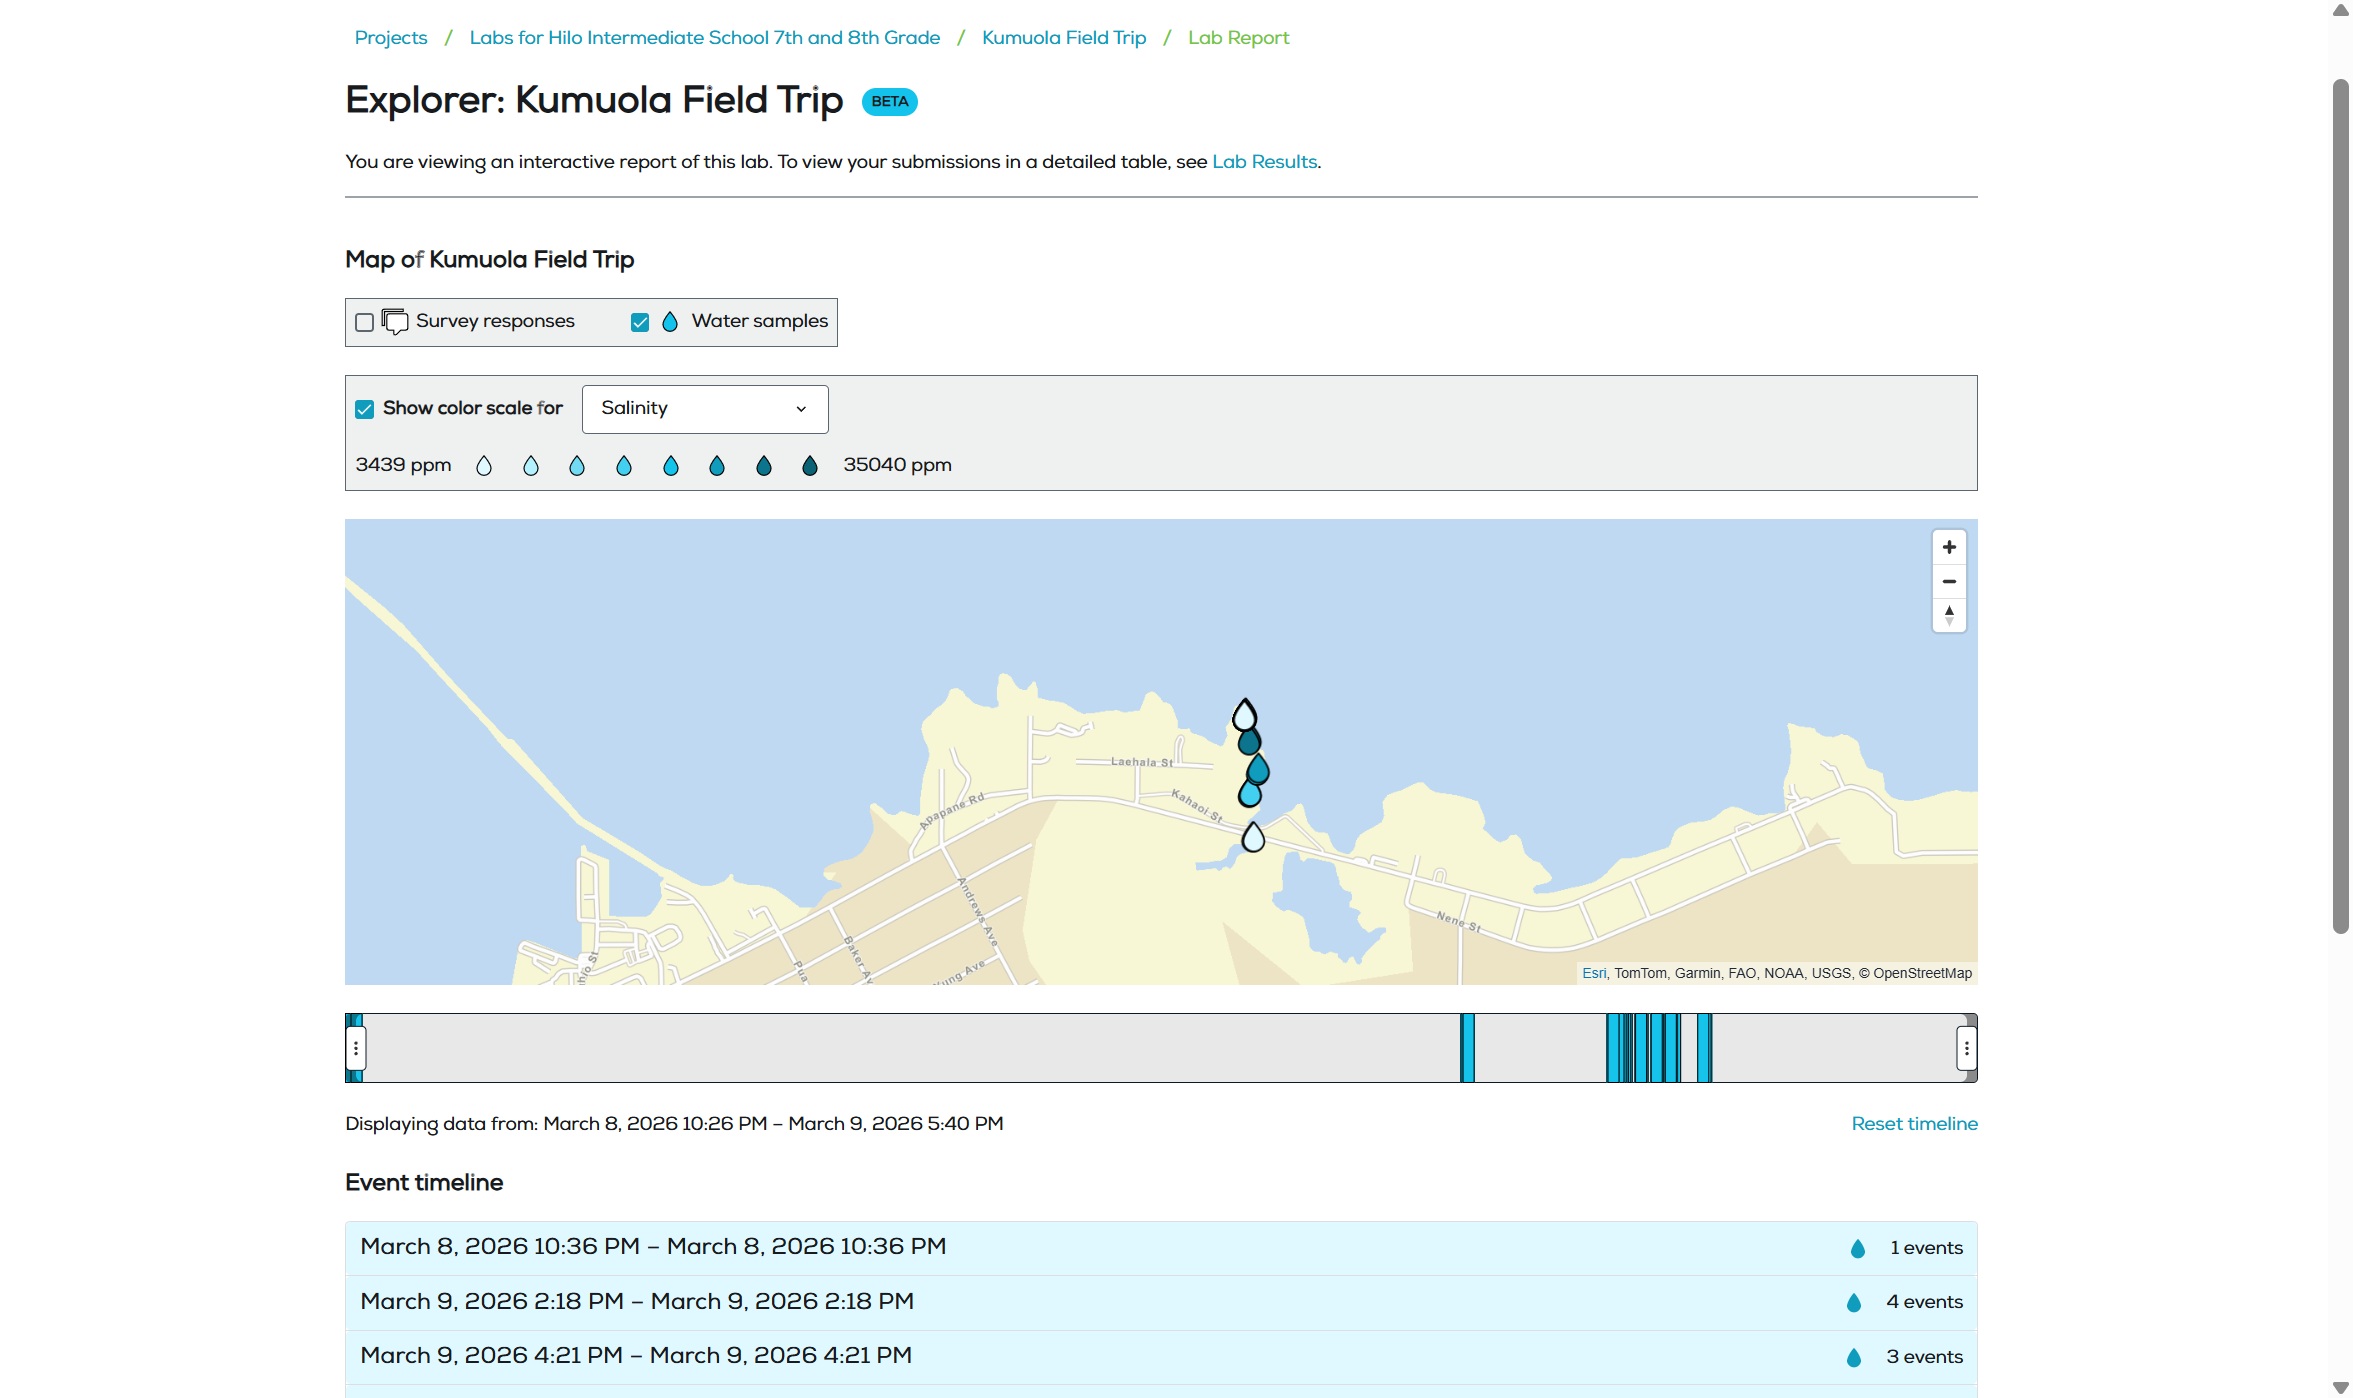
I built an interactive map interface to collect participants’ responses to a lab module and summarize the outcome of the activity with LLM assistance.
Built with 🤘🏻 by Caroline Dinh


